
Featured Projects
|
Dimensionality reduction (DR) is often used for exploring the evolution patterns of a collection of dynamic ego-networks. However, DR often lacks flexibility: as analysts' questions evolve during data exploration, the low-dimensional projection remains static, limiting the depth of exploration. To address the inflexibility of DR, we designed a data transformation pipeline which enables analysts to transform dynamic ego-networks into event sequences for steering MDS to create different scatterplots of dynamic ego-networks. 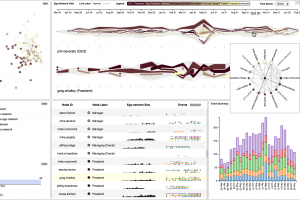 |
The Augmented Reality experience, The Lights of St. Etienne, uses the AR-browser Argon as a platform for an embodied, location-based experience in St Etienne Cathedral in Metz. The experience takes into account the cultural heritage and ‚"hidden" stories embedded in its architecture, windows, and ornamentations. Lights focuses on five separate sites (geo-spots) in and around the cathedral to explore various dimensions of the cathedral, its history, and its place in Metz. 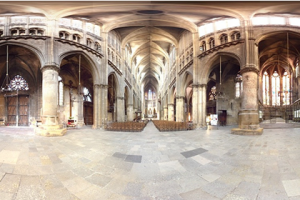 |
Our project develops a mobile teaching tool for cisgender Greek fellows/allies that promotes empathy-building in relation to their transgender and nonbinary peers. The tool aims towards the cisgender members of Greek life on Georgia Tech's campus. It helps users to explore what it means to be transgender or nonbinary while also being involved in Greek life on campus. Website: |
About GVU

RESEARCH
23 Core Areas

PEOPLE
300 Researchers

PROJECTS
250 Current

LABS
80 Partners

FUNDING
$9 Million in Grants
GVU Resource Labs
App Lab
Built for Success
A mobile computing "hackerspace."
Visit the App Lab website
Location: TSRB 333

GVU Prototyping Lab
From Concept to Creation
A rapid prototyping "makerspace."
Visit the Prototyping Lab website
Location: TSRB Basement

GVU Craft Lab
Making for All
A soft-goods "makerspace."
Visit the Craft Lab website
Location: TSRB 225B

Usability Lab
Testing Methods and Technology
An adaptable project testing space.
Visit the Usability Lab website
Location: TSRB 216
