
| John Stasko |
|
| Alex Bendeck |
|
| Yu Fu |
|
| Hayeong Song |
|
The Information Interfaces
Group, an HCI research group in the School of Interactive
Computing at Georgia Tech,
develops computing technologies that help people take
advantage of information to enrich their lives.
More about the lab approach
 |
Natural Visualization Creating natural visualization systems incorporating multiple interaction modalities including speech and touch. |
|
 |
Data Illustrator
and Data Animator Creating rich, expressive infographics, visualizations, and animations without needing to program. |
|
 |
Jigsaw Using visualization and visual analytics to help analysis and sensemaking on text document collections. |
|
 |
Sports Data Visualization Visualizing sports data to help people understand, analyze, and predict sporting events. |
|
 |
ICE-T Value-Driven
Visualization Evaluation Evaluating visualizations through heuristic, value-focused metrics. |
|
 |
Civic Geovisualization Mapping and visualizing urban data from multiple stakeholders to promote civic discourse. |
|
 |
CiteVis Exploring conference paper citation data visually. |
|
 |
Touch Interaction Developing interaction techniques for visualization on touch-based tablet and mobile devices. |
|
 |
Social Media Visual Analytics Helping people analyze and understand social media through interactive visualization and other techniques. |
|
 |
Graph-Level Operations Identifying the building blocks of graph visualization. |
|
 |
Rosemary Building novel interactive visualizations without programming. |
|
 |
Information Visualization
and Visual Analytics Helping people explore, analyze, and understand data through interactive visualization techniques and systems. |
|
 |
SetVis Exploring boolean set data through visualization and direct manipulation. |
|
 |
Behavis Using visual analytics to help psychologists explore social and communicative behaviors. |
|
 |
Visual Analytics for
Intelligence Analysis Informing the design of visual analytics systems for intelligence analysis. |
|
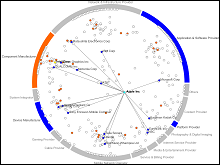 |
dotlink360 Analyzing and exploring converging business ecosystems through visual analytics. |
|
 |
Dust & Magnet Assisting people understand multivariate data sets using a magnet metaphor-based visualization. |
|
 |
Ploceus Supporting flexible network modeling for visual analysis of spreadsheets and databases. |
|
 |
Imprint Empowering workers to use visualizations of printer data as a basis for conversation and reflection. |
|
 |
SellTrend Enabling real-time awareness and exploratory analysis of temporal, categorical event transactions. |
|
 |
The Buzz Supporting end-user mashup creation and content aggregation onto photo and text collages. |
|
 |
InfoCanvas Developing Information Art: Virtual paintings that peripherally convey information to people. |
|
 |
FundExplorer Aiding equity investors with mutual fund portfolio diversification through the use of Context Treemaps. |
|
 |
SunBurst Developing circular, space-filling visualizations for depicting information hierarchies and trees. |
|
 |
Software Visualization Helping people understand software through visualization of programs, data structures, algorithms, and executions. |
|
|
John received the 2023 Lifetime Achievement Award from the IEEE Computer Society Visualization and Graphics Technical Community (VGTC). Award description and recipients. Yu is presenting our paper about Visually comparing NBA shot data at the VIS 23 Conference in Melbourne, Austraila. We had a paper accepted on the role of visualization in contemporary journalism in the IEEE TVCG journal. (pdf) John was named an ACM Fellow for the class of 2022. |
CS 6730 -
DataVis Class
CS 7450 -
InfoVis Class
- GT Visualization Lab
-- School of Interactive Computing
--- College of Computing
---- GVU Center
----- Georgia Tech