
![]()
| InfoCanvas: Information Art |
Team Members: John Stasko, Dave McColgin, Todd Miller, Chris Plaue, Zach Pousman
Beach InfoCanvas New version posted: 5/24/05
You can have your very own InfoCanvas by downloading the example beach InfoCanvas. Currently, this InfoCanvas monitors both general information (stocks, time, web images) and information specific to the city of Atlanta (weather, traffic, airfares). It is easy for you to change the city being focused on, however.
All you need is an always-on Internet connection (ie. DSL or a LAN) and Java 1.3 or higher installed on your machine. (If you need Java, download the appropriate JRE from java.sun.com. If you aren't sure whether or not you already have it installed, try using the InfoCanvas. If it does not load, then you likely need to install Java.)
Once you have downloaded the InfoCanvas zip file (first link above), you should unzip the package. Next, read the README.txt file for directions on how to run the system. (On Windows machines, it's quite simple. Just double-click on the "runcanvas" icon.) It should pop up quickly, but will take a minute or two to begin displaying actual data.
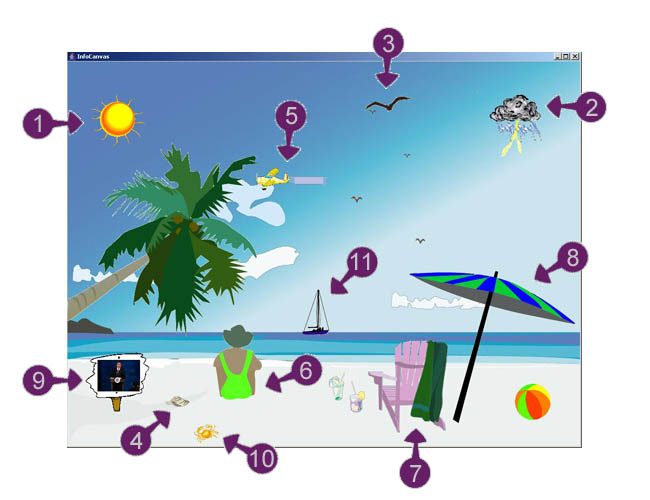
Here is what the canvas represents:
| 1. Today's forecasted weather condition for Atlanta is shown on the top-left |
| 2. Tomorrow's forecasted weather condition for Atlanta is shown on the top-right |
| 3. The current temperature is the height of the largest sea gull. The smaller seagulls are a scale, denoting 20, 40, 60, and 80 degrees. 80 is at the top, 20 at the bottom. |
| 4. The day's change for Coca-Cola stock is shown by either a sea shell (stock is up) or a watermelon (stock is down). A larger icon indicates an upward or downward change of more than 2%. |
| 5. The performance of the Dow Jones Index is the height of the plane in the sky. The top of the screen is up 100 points or more and the shoreline is down 100 points or more, with a continuous scale in-between. |
| 6. Traffic South-bound on the I-75/85 Connector in Atlanta is the color of the woman's bathing suit (green is for an average speed > 50mph, yellow is for speeds between 25-49mph, red is speeds < 25mph) |
| 7. Traffic North-bound on I-75 inside the Perimeter is the color of the towel on chair (Same scale as above) |
| 8. Traffic North-bound on I-85 inside the Perimeter is the color of the umbrella other than blue (Same scale as above) |
| 9. The latest image from cnn.com is shown on the sign post |
| 10. The current lowest price for a non-stop flight from Atlanta to DC's Reagan airport is the horizontal position of the crab in the sand. The left edge is $0 and the right edge is $600. |
| 11. Current time is shown by the boat sailing from left-to-right across the horizon. Left-side is 8am, right-side is 6pm. |
For details on how to change the city for weather, the website for the image, the stock being watched, and the airfare details, please examine the README file in the distribution. You can easily customize the InfoCanvas to your desired values.
InfoCanvas Home | Approach | Downloads | Flash Overview | In the News