
Few areas involve, generate, and celebrate data in the manner that sports does. Almost any sport, be it individual or team, produces large amounts of data as the result of matches, data that then can be studied and used in order to improve for the future. Large amounts of data lend themselves to statistical analytics, and this lies at the core of the area known as "Sports Analytics". This area continues to gain popularity and is perhaps most connected to the sport of baseball, largely through the work of people like Bill James and through books and films such as Moneyball. More recently, other sports, including basketball, soccer, professional football, ice hockey, and golf have begun to be the focus of analytics research. Unfortunately, there has been surprisingly little application of visualization technology to sports data. There simply is a dearth of tools that present sports data and allow people to explore and analyze the data interactively. Such tools could not only enhance the enjoyment of fans, but also assist media coverage and team officials' decision making.
Here at Georgia Tech, we created and taught a seminar on Sports Analytics. We were fortunate to have some of the top people in Sports Analytics visit and give talks. We also co-organized the very first Workshop on Sports Data Visualization which was held at the IEEE VIS 2013 meeting. In 2018 we co-authored a EuroVis STAR Report that reviews the state of the art in sports data visualization.
Specific projects on sports data visualization from our lab include: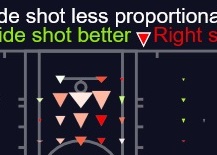 |
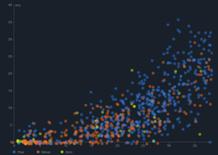
HoopInsight - Comparing shooting performance in the NBA. |
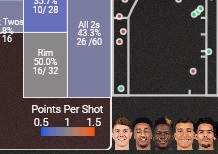 |
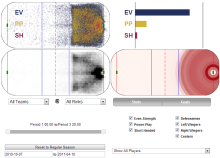
NBA Game Vis - Visualizing NBA Game data. |
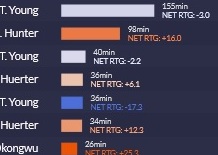 |
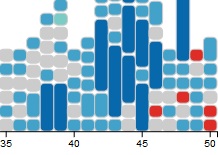
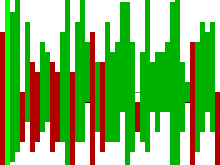
NBA Lineup Vis - Visualizing how different NBA lineups performed over a season. |
 |
NFL Draft Vis - Visualizing the NFL Draft. |
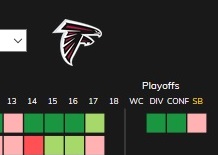 |
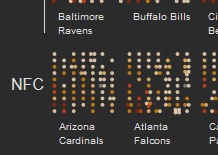
NFL Super Bowls - Visualizing NFL season and Super Bowl History. |
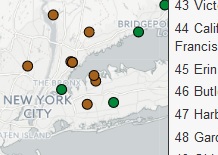 |
Best Golf Courses - Visualizing the Top-rated Golf Courses in the United States. |
 |
Cricket Matches - Visualizing matches from the 2015 ICC World Cup of Cricket. |
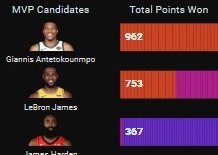 |
NBA MVP Voting - Showing who did and did not vote for different players in the MVP voting. |
 |
NBAVis - Visualizing NBA Player and Team Data. |
 |
SnapShot - Visualizing Ice Hockey Shot Data. |
 |
SportVis - Visualizing baseball data. |