


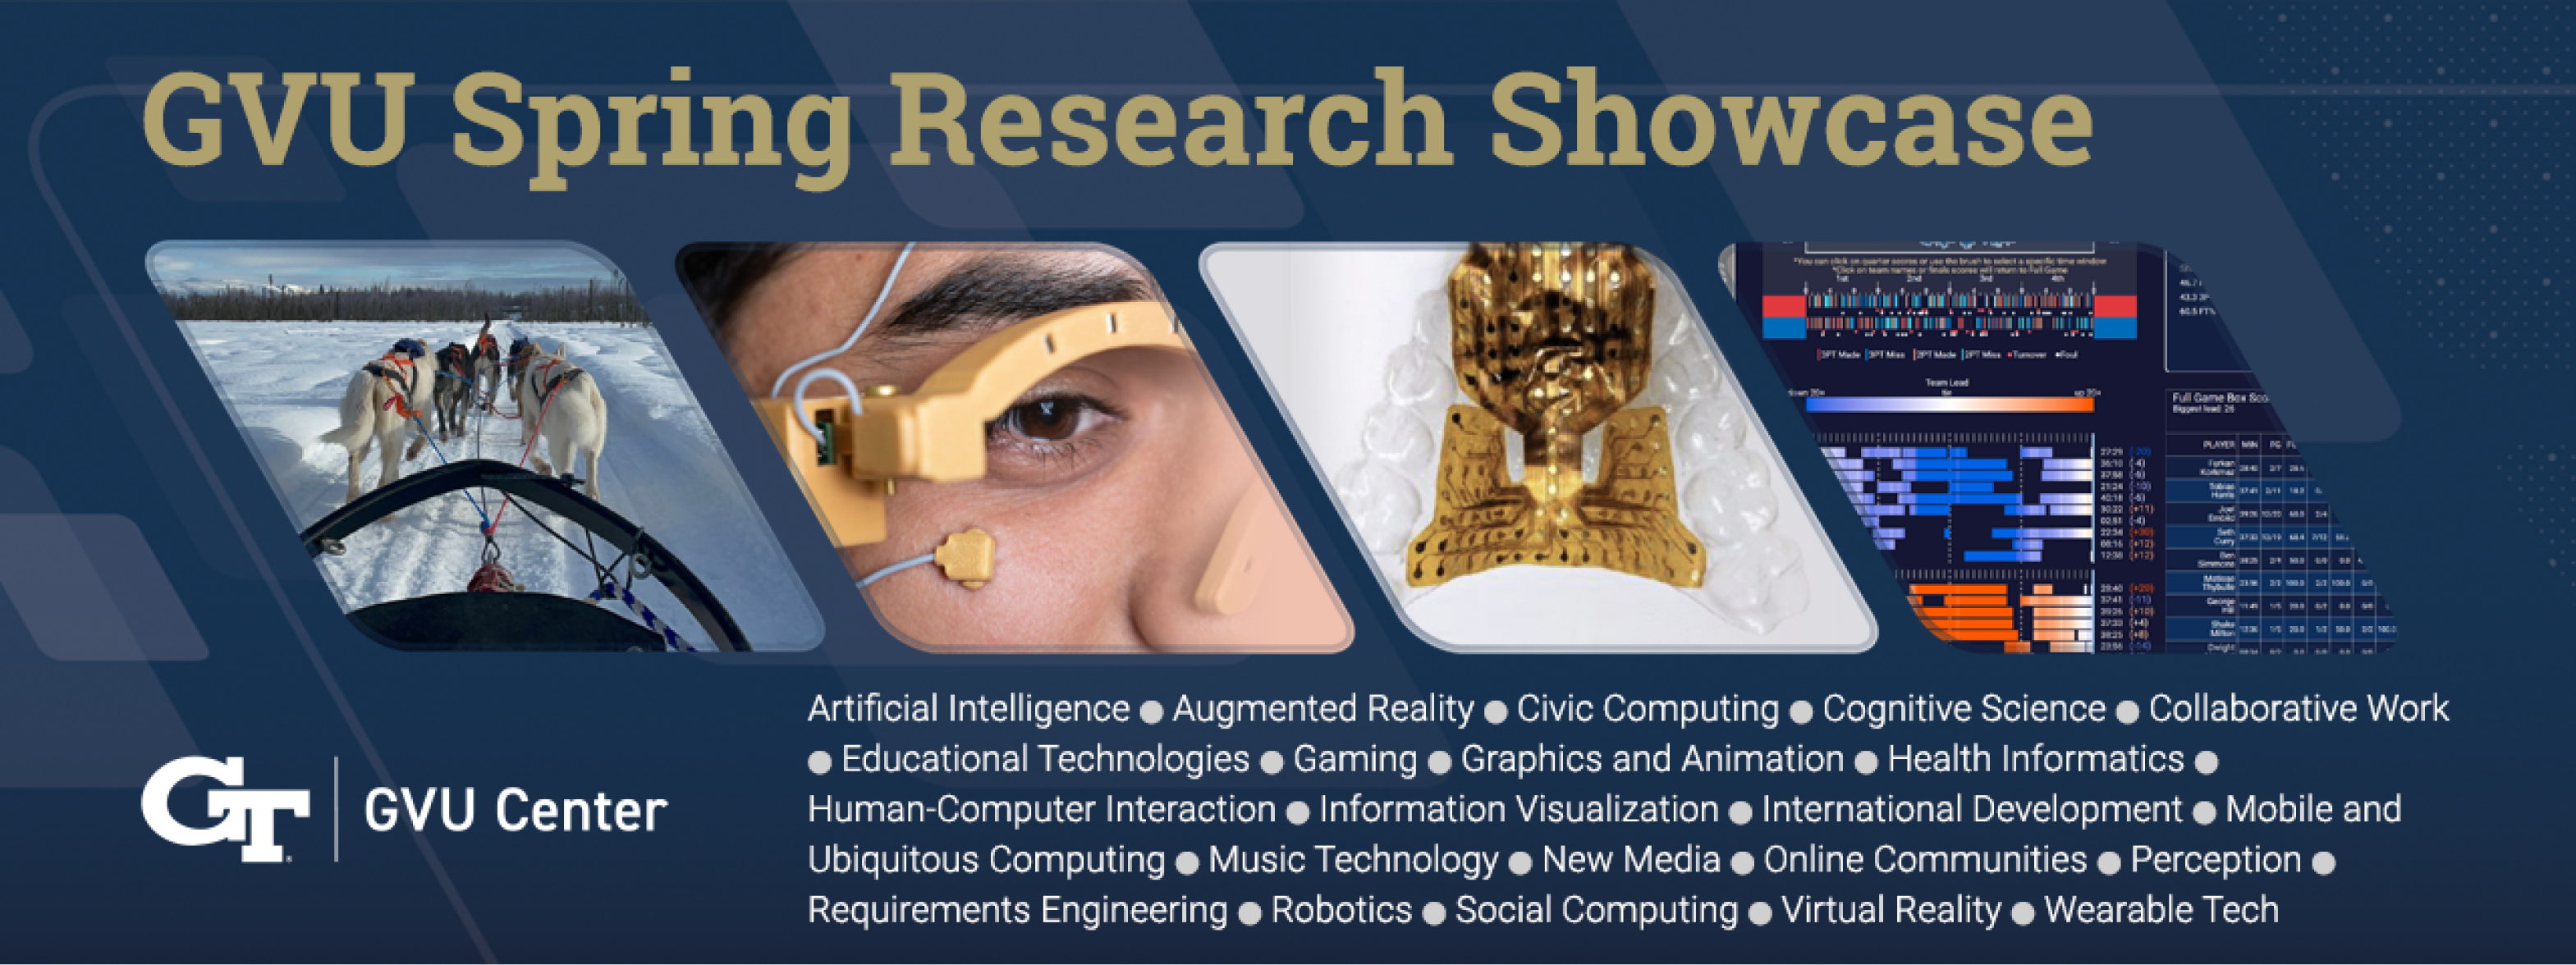
Featured Projects
|
This study employs gaming technologies and techniques to create an intelligent encapsulated conversational agent (ECA) to act as a virtual coach who will lower the cognitive effort required by prostate cancer patients to understand key aspects of decision-making, provide more appropriate reference points from which patients more accurately interpret personal risk, and frame information to optimize the patient's chances of applying his own preferences and values to the decision at hand. 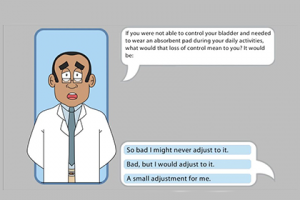 |
Our project aims to explore how to create immersive interactions, motivate interactors to engage and enhance interactor's experience in VR narrative with incentives and rewarding system design, possibly using full-body tracking technology. The narrative of our project starts inside a coffin where the interactor will hear MJ's thriller. Moving outside the coffin, he will find MJ zombie dancing with other zombies on the stage for a huge zombie audience. Then MJ zombie will invite him to dance along with the music. When he gets the correct move, audience applaud. We would like to design incent |
Alone in a strange and dark forest, you find a lantern, your sole source of light and comfort. But soon you are joined by two characters, and each makes a compelling argument as to why you should give the lantern to them. Who do you trust? You decide! This virtual reality experience places you at the penultimate moment of Cartoon Network's Emmy-award winning "Over the Garden Wall" mini-series.  |
About GVU

RESEARCH
23 Core Areas

PEOPLE
300 Researchers

PROJECTS
250 Current

LABS
80 Partners

FUNDING
$9 Million in Grants
GVU Resource Labs
App Lab
Built for Success
A mobile computing "hackerspace."
Visit the App Lab website
Location: TSRB 333

GVU Prototyping Lab
From Concept to Creation
A rapid prototyping "makerspace."
Visit the Prototyping Lab website
Location: TSRB Basement

GVU Craft Lab
Making for All
A soft-goods "makerspace."
Visit the Craft Lab website
Location: TSRB 225B

Usability Lab
Testing Methods and Technology
An adaptable project testing space.
Visit the Usability Lab website
Location: TSRB 216
