
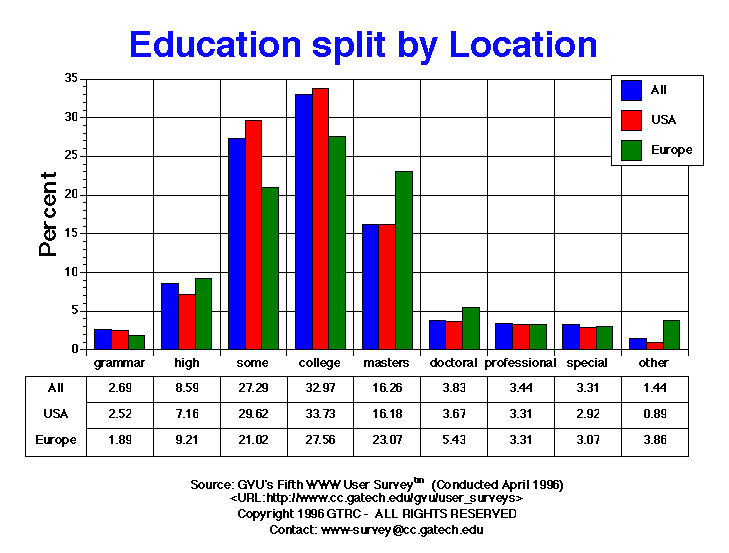
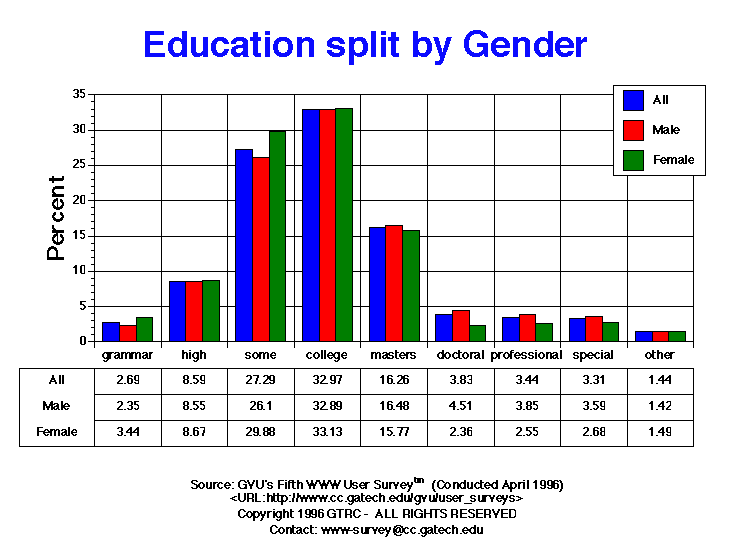
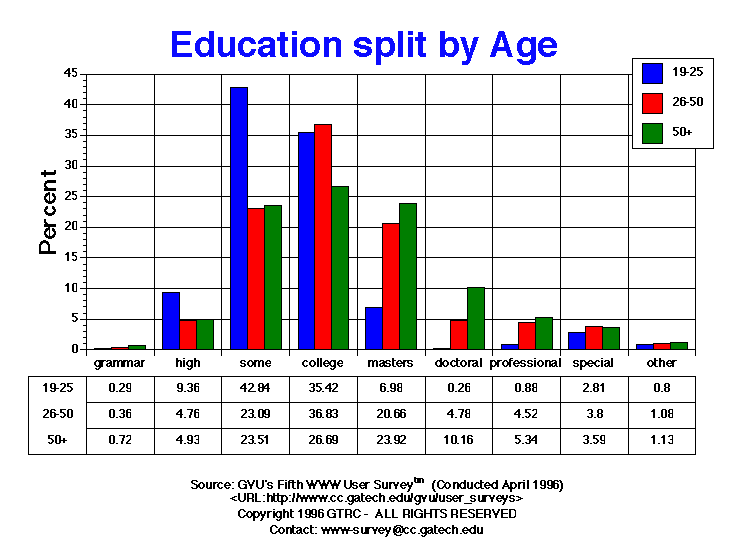
| education | All | Male | Female | USA | Europe | 19-25 | 26-50 | 50+ |
| abitur | 21 0.18% |
20 0.25% |
1 0.03% |
0 0.00% |
20 1.57% |
10 0.37% |
9 0.13% |
0 0.00% |
| college | 3869 32.97% |
2646 32.89% |
1223 33.13% |
2904 33.73% |
350 27.56% |
969 35.42% |
2560 36.83% |
260 26.69% |
| doctoral | 450 3.83% |
363 4.51% |
87 2.36% |
316 3.67% |
69 5.43% |
7 0.26% |
332 4.78% |
99 10.16% |
| grammar | 316 2.69% |
189 2.35% |
127 3.44% |
217 2.52% |
24 1.89% |
8 0.29% |
25 0.36% |
7 0.72% |
| high | 1008 8.59% |
688 8.55% |
320 8.67% |
616 7.16% |
117 9.21% |
256 9.36% |
331 4.76% |
48 4.93% |
| masters | 1908 16.26% |
1326 16.48% |
582 15.77% |
1393 16.18% |
293 23.07% |
191 6.98% |
1436 20.66% |
233 23.92% |
| other | 169 1.44% |
114 1.42% |
55 1.49% |
77 0.89% |
49 3.86% |
22 0.80% |
75 1.08% |
11 1.13% |
| professional | 404 3.44% |
310 3.85% |
94 2.55% |
285 3.31% |
42 3.31% |
24 0.88% |
314 4.52% |
52 5.34% |
| some | 3203 27.29% |
2100 26.10% |
1103 29.88% |
2550 29.62% |
267 21.02% |
1172 42.84% |
1605 23.09% |
229 23.51% |
| special | 388 3.31% |
289 3.59% |
99 2.68% |
251 2.92% |
39 3.07% |
77 2.81% |
264 3.80% |
35 3.59% |
GVU's WWW Surveying Team
Graphics, Visualization, & Usability Center
College of Computing
Georgia Institute of Technology
Atlanta, GA 30332-0280