

| income (x $1000) | All | Male | Female | USA | Europe | 19-25 | 26-50 | 50+ |
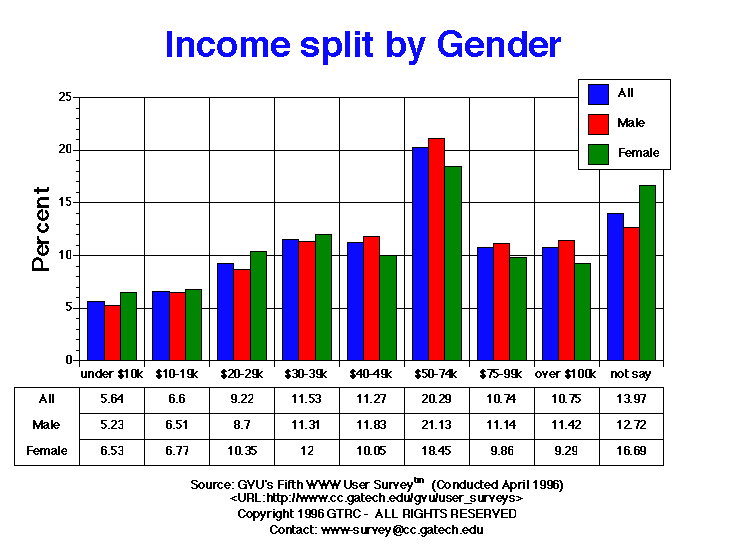
| under10 | 662 5.64% |
421 5.23% |
241 6.53% |
388 4.51% |
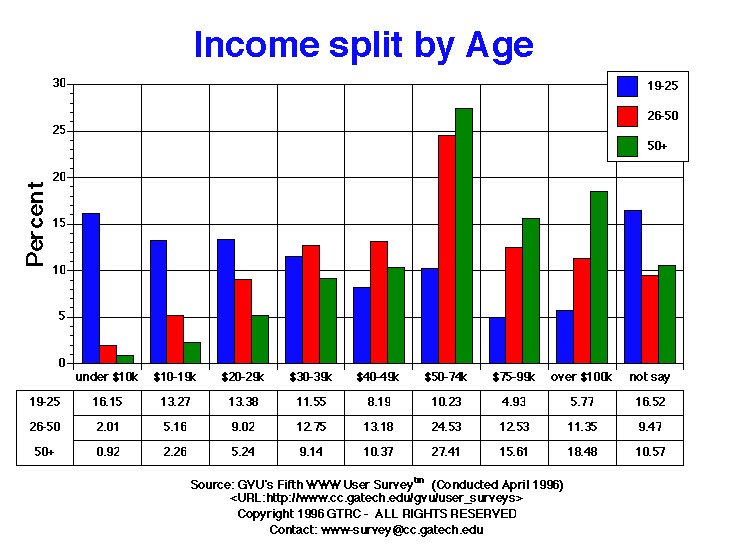
169 13.31% |
442 16.15% |
140 2.01% |
9 0.92% |
| 10-19 | 774 6.60% |
524 6.51% |
250 6.77% |
517 6.01% |
123 9.69% |
363 13.27% |
359 5.16% |
22 2.26% |
| 20-29 | 1082 9.22% |
700 8.70% |
382 10.35% |
778 9.04% |
129 10.16% |
366 13.38% |
627 9.02% |
51 5.24% |
| 30-39 | 1353 11.53% |
910 11.31% |
443 12.00% |
974 11.31% |
144 11.34% |
316 11.55% |
886 12.75% |
89 9.14% |
| 40-49 | 1323 11.27% |
952 11.83% |
371 10.05% |
963 11.19% |
128 10.08% |
224 8.19% |
916 13.18% |
101 10.37% |
| 50-74 | 2381 20.29% |
1700 21.13% |
681 18.45% |
1866 21.67% |
195 15.35% |
280 10.23% |
1705 24.53% |
267 27.41% |
| 75-99 | 1260 10.74% |
896 11.14% |
364 9.86% |
966 11.22% |
115 9.06% |
135 4.93% |
871 12.53% |
152 15.61% |
| over100 | 1262 10.75% |
919 11.42% |
343 9.29% |
1004 11.66% |
87 6.85% |
158 5.77% |
789 11.35% |
180 18.48% |
| not_say | 1639 13.97% |
1023 12.72% |
616 16.69% |
1153 13.39% |
180 14.17% |
452 16.52% |
658 9.47% |
103 10.57% |
GVU's WWW Surveying Team
Graphics, Visualization, & Usability Center
College of Computing
Georgia Institute of Technology
Atlanta, GA 30332-0280