
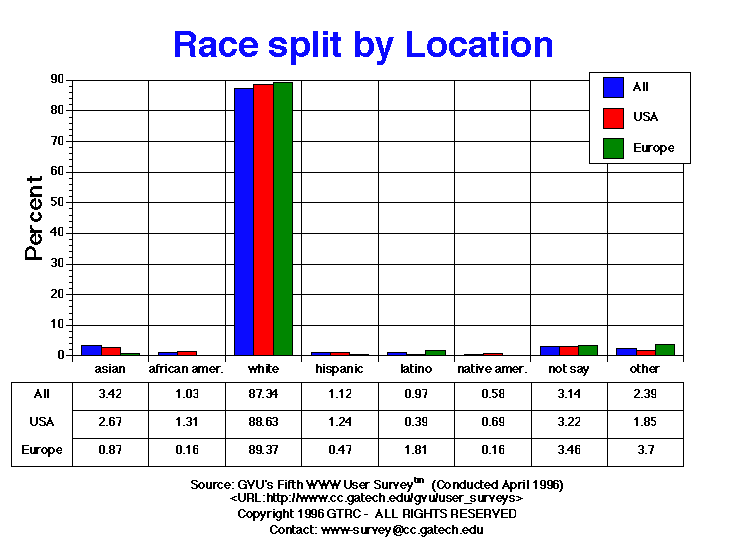
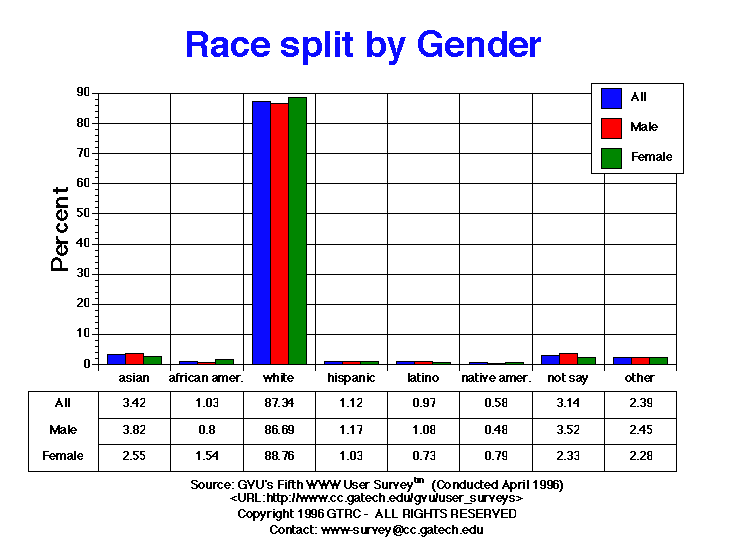
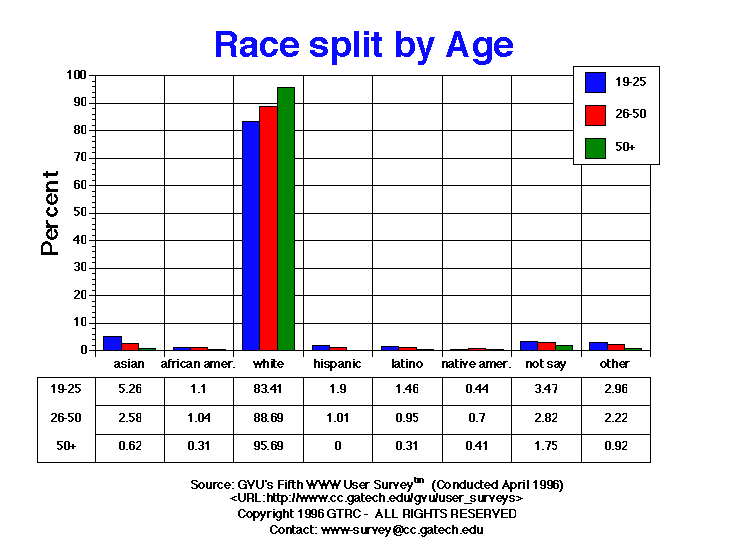
| race | All | Male | Female | USA | Europe | 19-25 | 26-50 | 50+ |
| asian | 401 3.42% |
307 3.82% |
94 2.55% |
230 2.67% |
11 0.87% |
144 5.26% |
179 2.58% |
6 0.62% |
| black | 121 1.03% |
64 0.80% |
57 1.54% |
113 1.31% |
2 0.16% |
30 1.10% |
72 1.04% |
3 0.31% |
| hispanic | 132 1.12% |
94 1.17% |
38 1.03% |
107 1.24% |
6 0.47% |
52 1.90% |
70 1.01% |
0 0.00% |
| latino | 114 0.97% |
87 1.08% |
27 0.73% |
34 0.39% |
23 1.81% |
40 1.46% |
66 0.95% |
3 0.31% |
| native | 68 0.58% |
39 0.48% |
29 0.79% |
59 0.69% |
2 0.16% |
12 0.44% |
49 0.70% |
4 0.41% |
| not_say | 369 3.14% |
283 3.52% |
86 2.33% |
277 3.22% |
44 3.46% |
95 3.47% |
196 2.82% |
17 1.75% |
| other | 281 2.39% |
197 2.45% |
84 2.28% |
159 1.85% |
47 3.70% |
81 2.96% |
154 2.22% |
9 0.92% |
| white | 10250 87.34% |
6974 86.69% |
3276 88.76% |
7630 88.63% |
1135 89.37% |
2282 83.41% |
6165 88.69% |
932 95.69% |
GVU's WWW Surveying Team
Graphics, Visualization, & Usability Center
College of Computing
Georgia Institute of Technology
Atlanta, GA 30332-0280