

| economic | All | Male | Female | USA | Europe | 19-25 | 26-50 | 50+ |
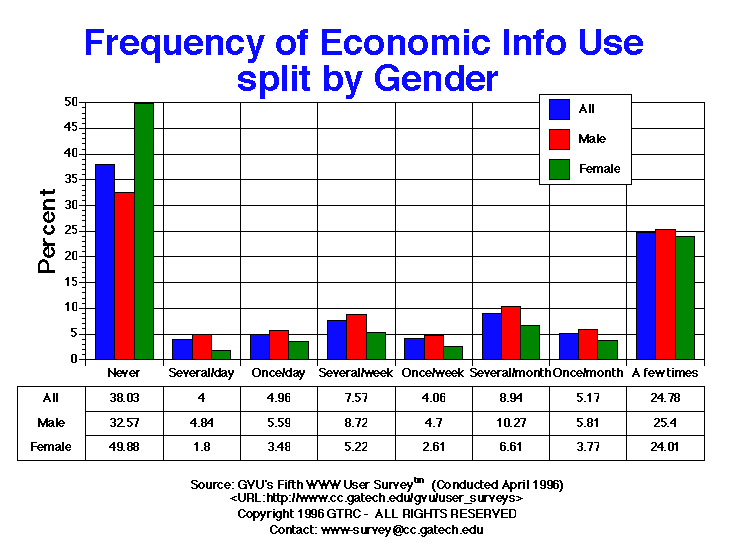
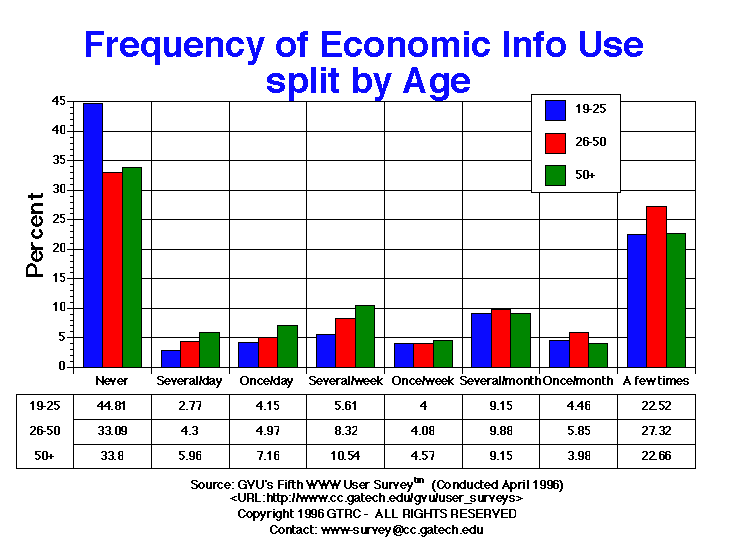
| A few times | 1640 24.78% |
1049 25.40% |
414 24.01% |
1101 25.01% |
150 25.42% |
293 22.52% |
985 27.32% |
114 22.66% |
| Don't know | 164 2.48% |
86 2.08% |
45 2.61% |
93 2.11% |
13 2.20% |
33 2.54% |
79 2.19% |
11 2.19% |
| Never | 2518 38.04% |
1346 32.59% |
860 49.88% |
1566 35.57% |
275 46.61% |
583 44.81% |
1193 33.09% |
170 33.80% |
| Once per day | 328 4.96% |
231 5.59% |
60 3.48% |
243 5.52% |
18 3.05% |
54 4.15% |
179 4.97% |
36 7.16% |
| Once per month | 342 5.17% |
240 5.81% |
65 3.77% |
232 5.27% |
30 5.08% |
58 4.46% |
211 5.85% |
20 3.98% |
| Once per week | 269 4.06% |
194 4.70% |
45 2.61% |
178 4.04% |
21 3.56% |
52 4.00% |
147 4.08% |
23 4.57% |
| Several times per day | 265 4.00% |
200 4.84% |
31 1.80% |
194 4.41% |
10 1.69% |
36 2.77% |
155 4.30% |
30 5.96% |
| Several times per month | 592 8.94% |
424 10.27% |
114 6.61% |
437 9.93% |
38 6.44% |
119 9.15% |
356 9.88% |
46 9.15% |
| Several times per week | 501 7.57% |
360 8.72% |
90 5.22% |
359 8.15% |
35 5.93% |
73 5.61% |
300 8.32% |
53 10.54% |
GVU's WWW Surveying Team
Graphics, Visualization, & Usability Center
College of Computing
Georgia Institute of Technology
Atlanta, GA 30332-0280