
Hours Per Week of "Fun" Computing
Notes:
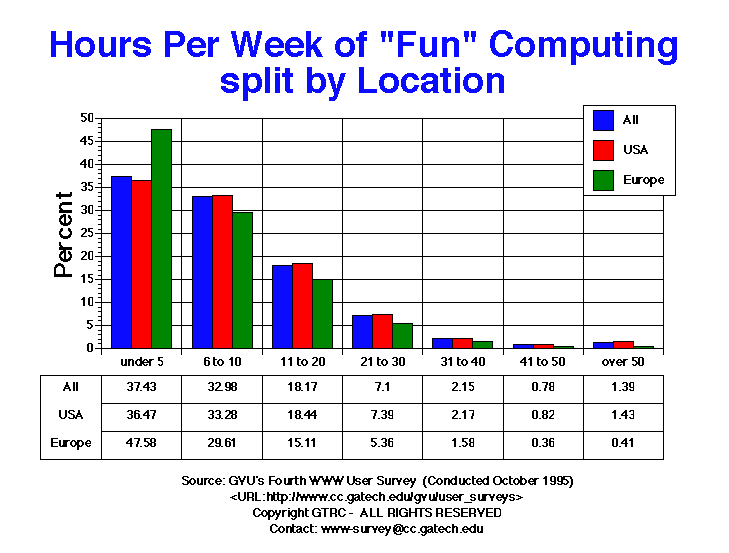
- Over a third of the users (37.4%) spend under 5 hours/week doing 'fun'
computing with 29.5% spending over 11 hours/week. The other third
(33.0%) spends between 6 and 10 hours/per week fun computing. This
distribution is not change significantly from the Third Survey.
- As with the Third Survey, European users are more likely to spend less
time fun computing that their US counterparts (47.6% vs 36.4%).
By Location
Notes:
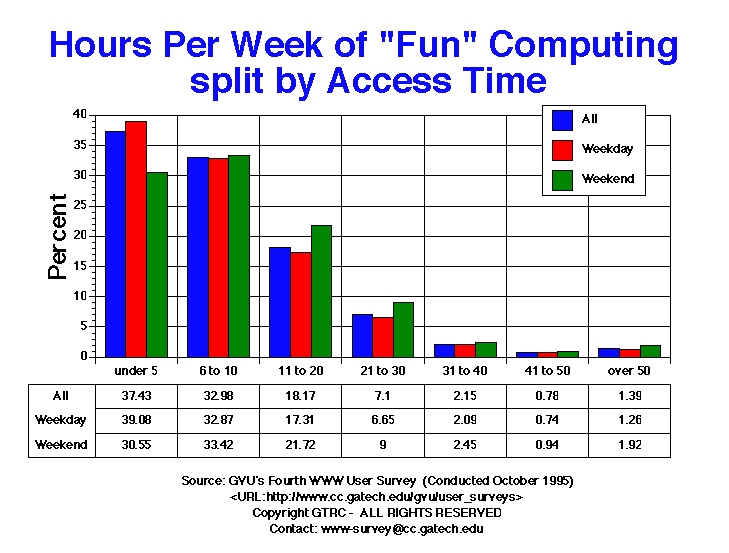
- As was observed with Prodigy users in the Third Survey, Weekend
users typically spend more time having fun with their computers than
Weekday users. 29.7% of the Weekend users spend between 11 and 20 hours/week
fun computing compared to only 24% for Weekday users. Comparatively,
39.1% of the Weekday users spend under 5 hours/week fun computing and
30.6% for Weekend users.
By Access Time
Notes:
- As observed in the Third Survey, women spent less time doing fun
computing than males (76.0% of women spent less than 11 hours/week vs
68.1% for men). This characterization of fits the stereotype that males
are heavy recreational computer users.
By Gender
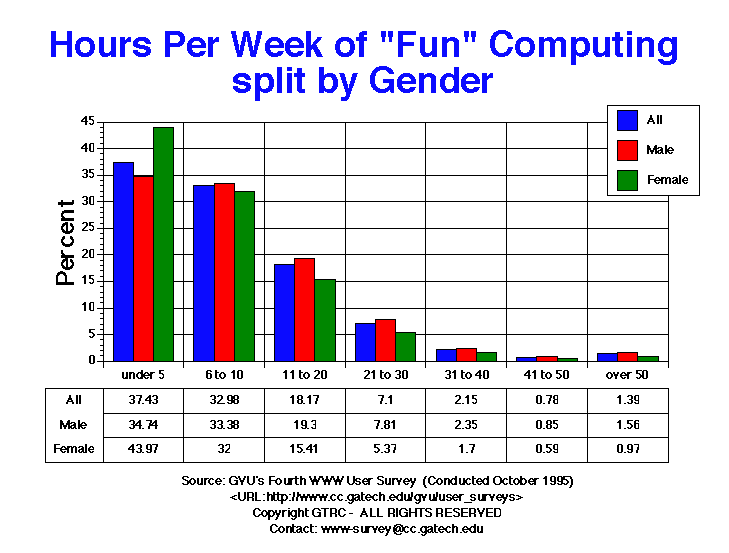
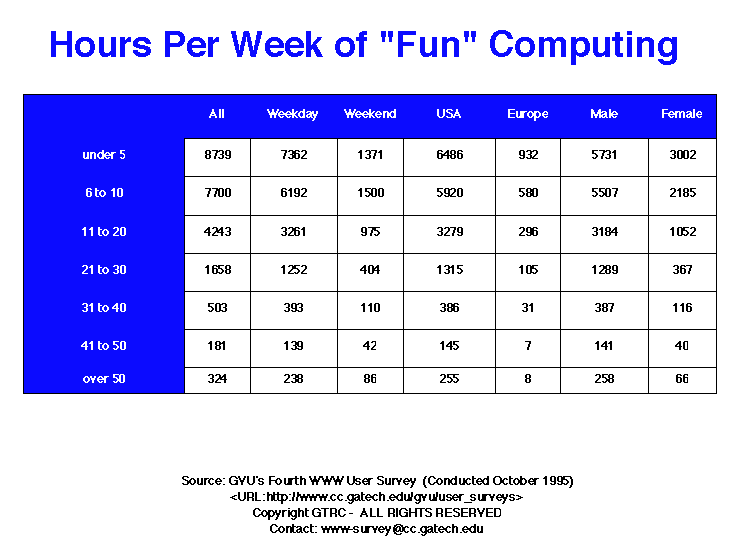
Table of Data for All Categories
For more information or to submit comments:
send e-mail to www-survey@cc.gatech.edu.
GVU's WWW Surveying Team
Graphics, Visualization, & Usability Center
College of Computing
Georgia Institute of Technology
Atlanta, GA 30332-0280