
| Falsification of Information | All | Male | Female | USA | Europe | 19-25 | 26-50 | 50+ |
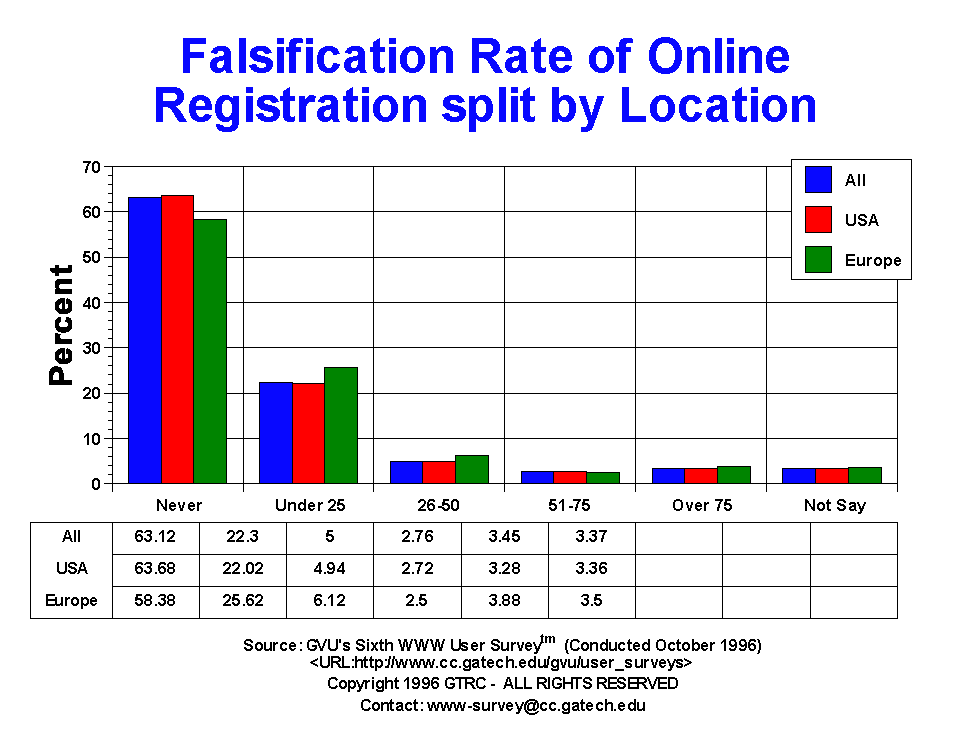
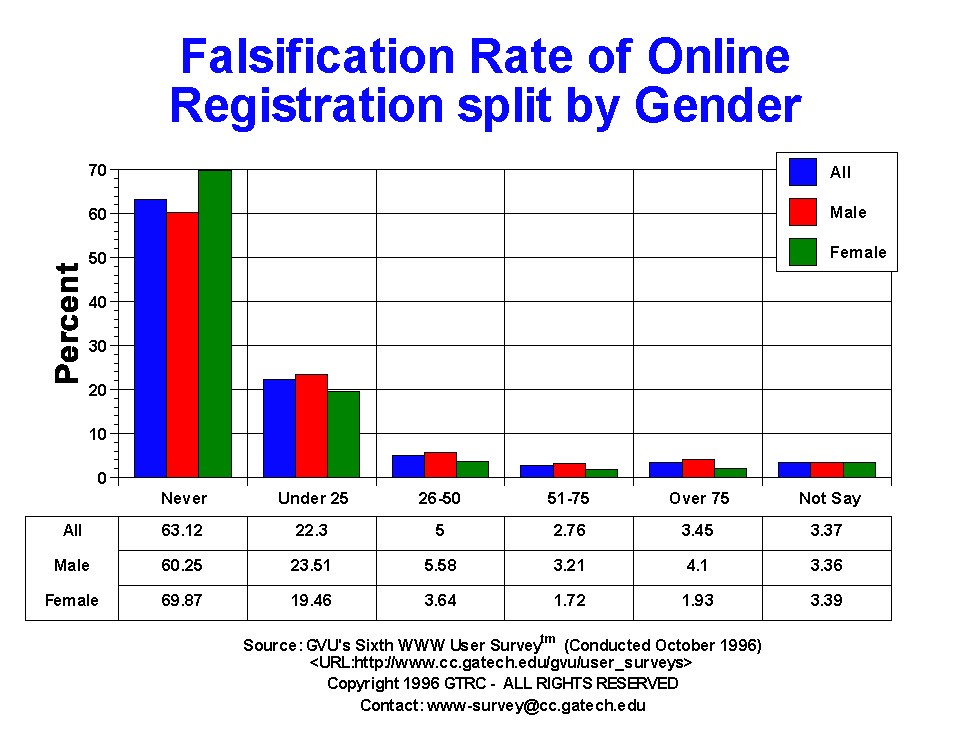
| 26-50 | 651.00 5.00% |
509.00 5.58% |
142.00 3.64% |
535.00 4.94% |
49.00 6.12% |
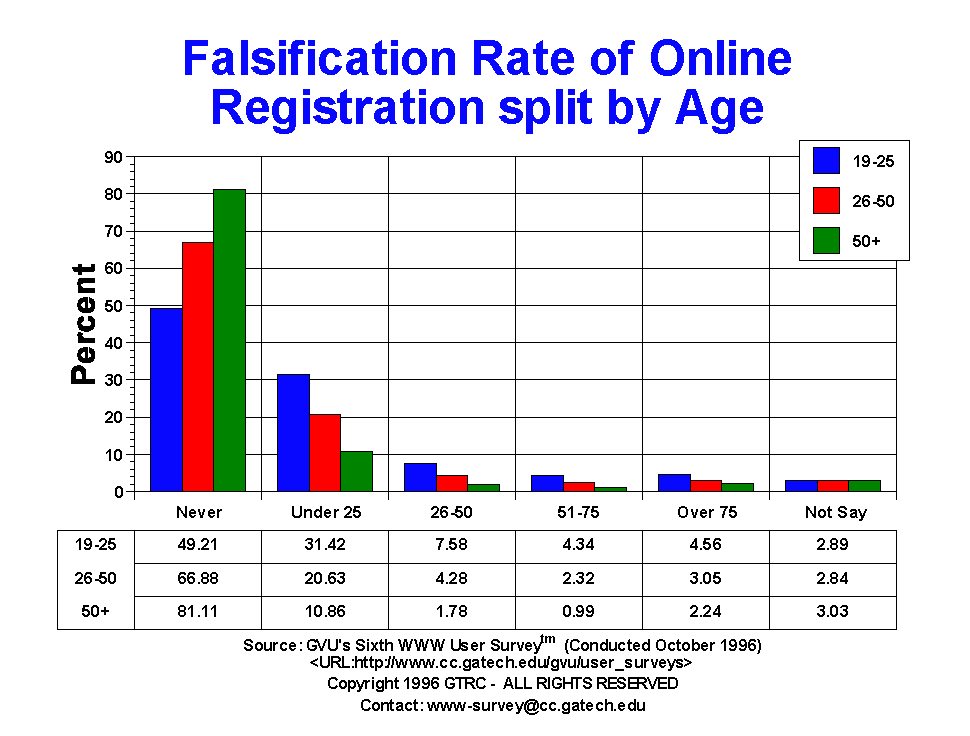
178.00 7.58% |
337.00 4.28% |
27.00 1.78% |
| 51-75 | 360.00 2.76% |
293.00 3.21% |
67.00 1.72% |
295.00 2.72% |
20.00 2.50% |
102.00 4.34% |
183.00 2.32% |
15.00 0.99% |
| Never | 8222.00 63.12% |
5500.00 60.25% |
2722.00 69.87% |
6899.00 63.68% |
467.00 58.38% |
1156.00 49.21% |
5269.00 66.88% |
1232.00 81.11% |
| Not Say | 439.00 3.37% |
307.00 3.36% |
132.00 3.39% |
364.00 3.36% |
28.00 3.50% |
68.00 2.89% |
224.00 2.84% |
46.00 3.03% |
| Over 75 | 449.00 3.45% |
374.00 4.10% |
75.00 1.93% |
355.00 3.28% |
31.00 3.88% |
107.00 4.56% |
240.00 3.05% |
34.00 2.24% |
| Under 25 | 2904.00 22.30% |
2146.00 23.51% |
758.00 19.46% |
2386.00 22.02% |
205.00 25.62% |
738.00 31.42% |
1625.00 20.63% |
165.00 10.86% |


GVU's WWW Surveying Team
Graphics, Visualization, & Usability Center
College of Computing
Georgia Institute of Technology
Atlanta, GA 30332-0280