
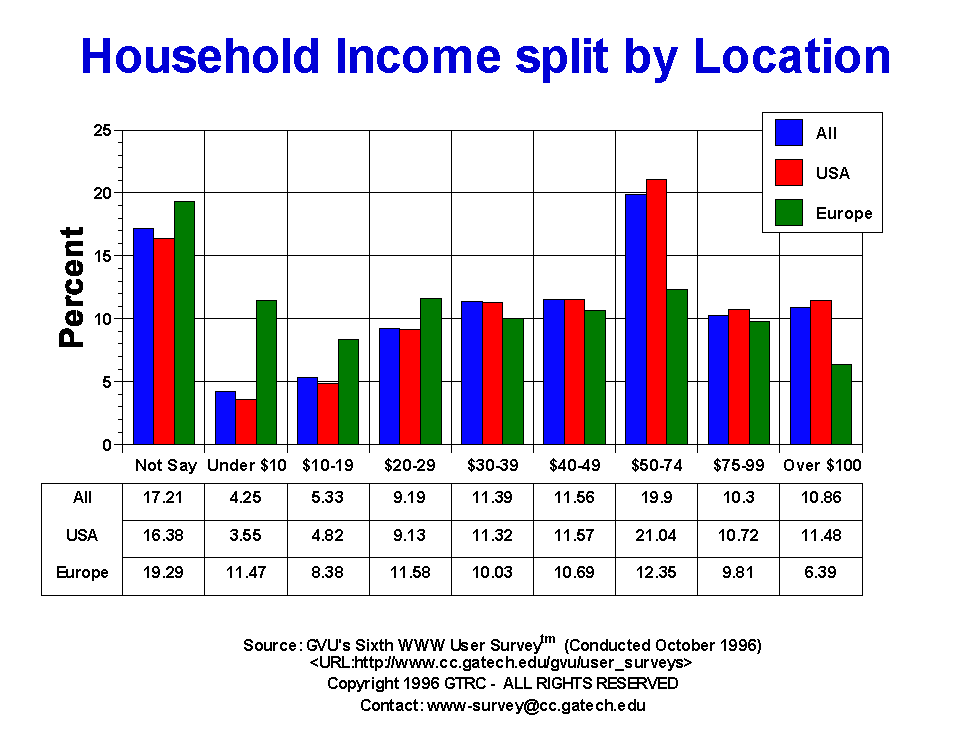
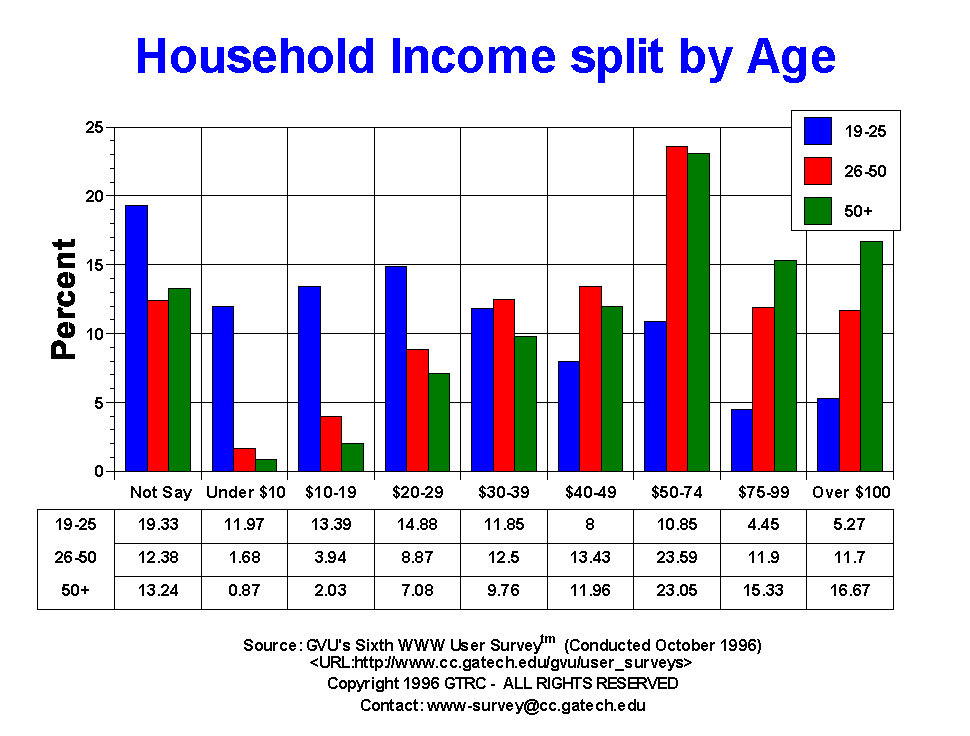
| Household Income | All | Male | Female | USA | Europe | 19-25 | 26-50 | 50+ |
| Under $10 | 620.00 4.25% |
385.00 3.85% |
235.00 5.13% |
428.00 3.55% |
104.00 11.47% |
320.00 11.97% |
146.00 1.68% |
15.00 0.87% |
| $10-19 | 777.00 5.33% |
533.00 5.33% |
244.00 5.33% |
581.00 4.82% |
76.00 8.38% |
358.00 13.39% |
342.00 3.94% |
35.00 2.03% |
| $20-29 | 1341.00 9.19% |
855.00 8.54% |
486.00 10.62% |
1102.00 9.13% |
105.00 11.58% |
398.00 14.88% |
770.00 8.87% |
122.00 7.08% |
| $30-39 | 1662.00 11.39% |
1121.00 11.20% |
541.00 11.82% |
1366.00 11.32% |
91.00 10.03% |
317.00 11.85% |
1085.00 12.50% |
168.00 9.76% |
| $40-49 | 1686.00 11.56% |
1150.00 11.49% |
536.00 11.71% |
1396.00 11.57% |
97.00 10.69% |
214.00 8.00% |
1166.00 13.43% |
206.00 11.96% |
| $50-74 | 2903.00 19.90% |
2071.00 20.69% |
832.00 18.17% |
2539.00 21.04% |
112.00 12.35% |
290.00 10.85% |
2048.00 23.59% |
397.00 23.05% |
| $75-99 | 1503.00 10.30% |
1120.00 11.19% |
383.00 8.37% |
1293.00 10.72% |
89.00 9.81% |
119.00 4.45% |
1033.00 11.90% |
264.00 15.33% |
| Not Say | 2510.00 17.21% |
1556.00 15.55% |
954.00 20.84% |
1976.00 16.38% |
175.00 19.29% |
517.00 19.33% |
1075.00 12.38% |
228.00 13.24% |
| Over $100 | 1584.00 10.86% |
1217.00 12.16% |
367.00 8.02% |
1385.00 11.48% |
58.00 6.39% |
141.00 5.27% |
1016.00 11.70% |
287.00 16.67% |

GVU's WWW Surveying Team
Graphics, Visualization, & Usability Center
College of Computing
Georgia Institute of Technology
Atlanta, GA 30332-0280