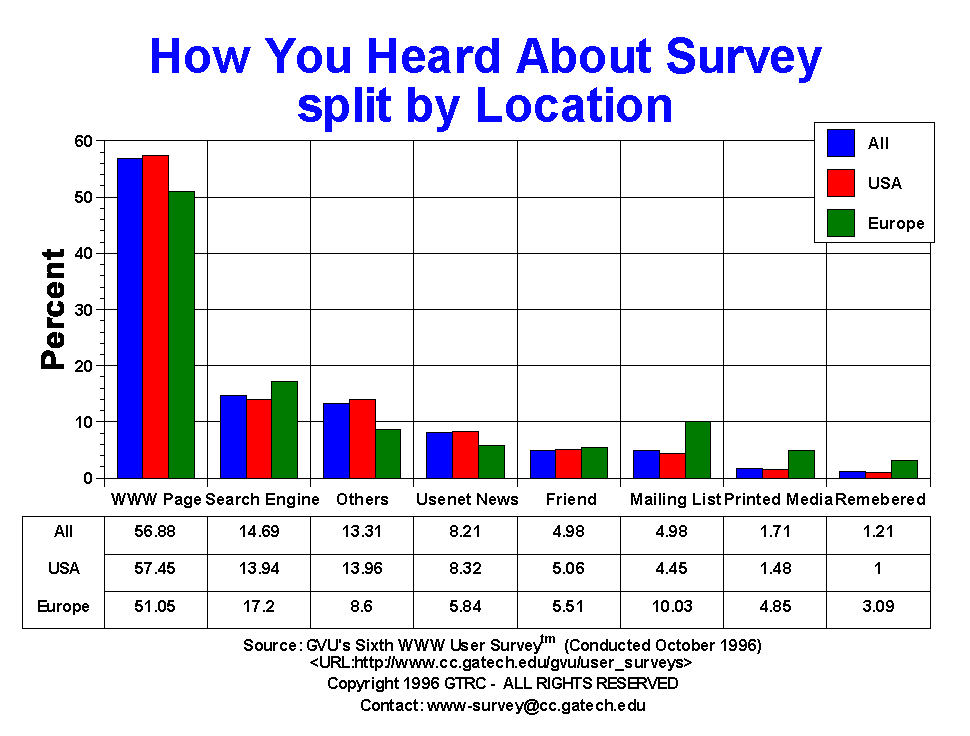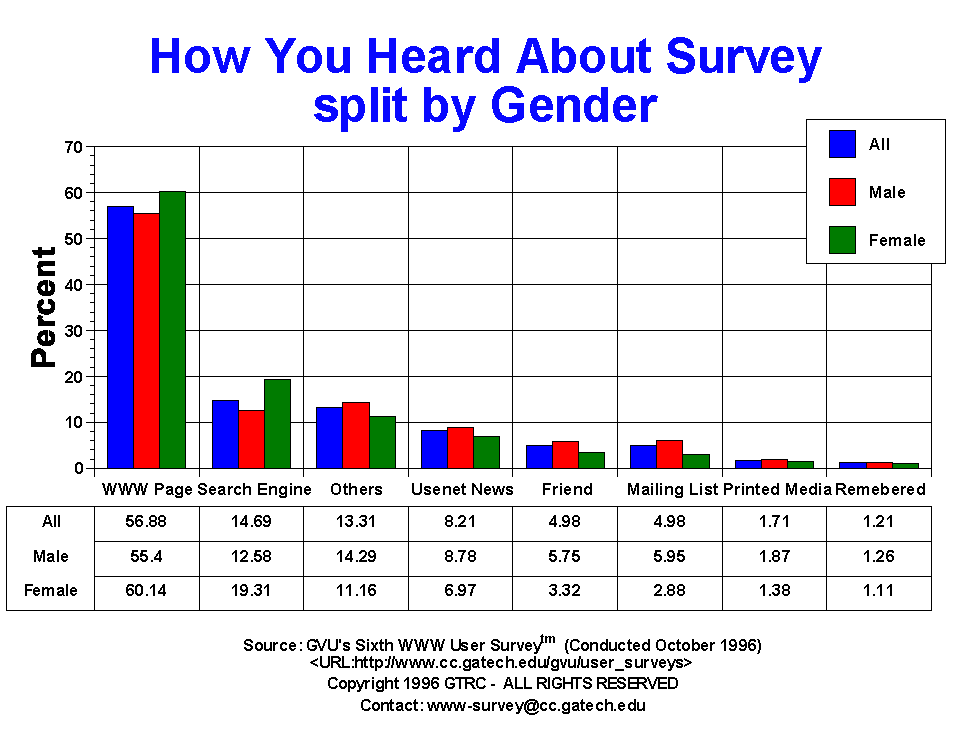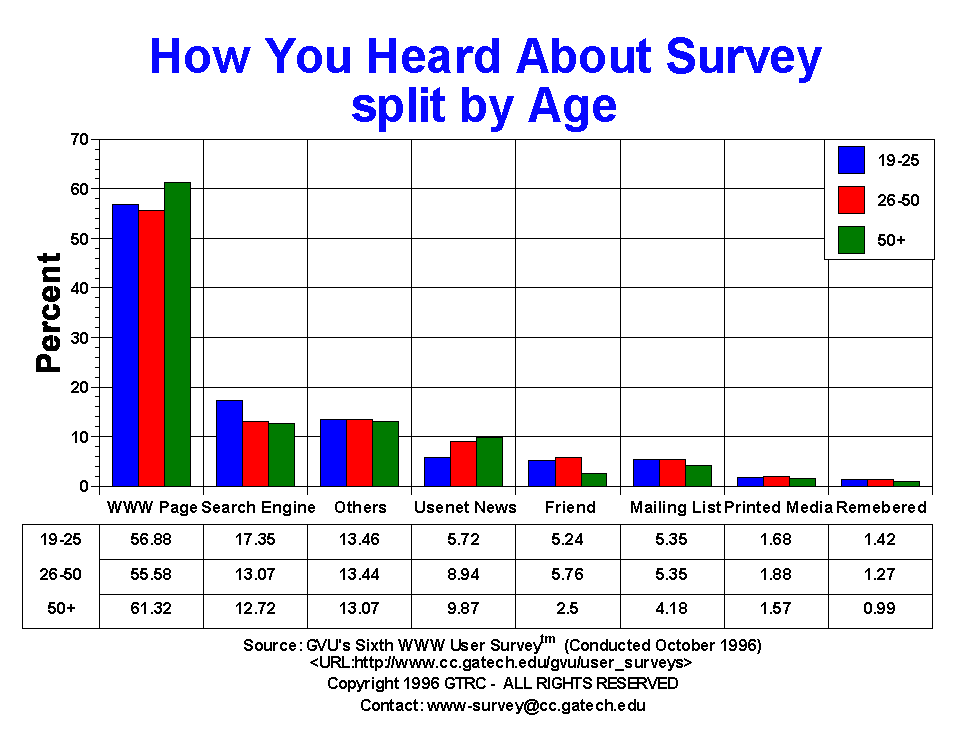

| How You Heard About Survey | All | Male | Female | USA | Europe | 19-25 | 26-50 | 50+ |
| Friend | 727.00 4.98% |
575.00 5.75% |
152.00 3.32% |
610.00 5.06% |
50.00 5.51% |
140.00 5.24% |
500.00 5.76% |
43.00 2.50% |
| Mailing List | 727.00 4.98% |
595.00 5.95% |
132.00 2.88% |
537.00 4.45% |
91.00 10.03% |
143.00 5.35% |
464.00 5.35% |
72.00 4.18% |
| Others | 1941.00 13.31% |
1430.00 14.29% |
511.00 11.16% |
1685.00 13.96% |
78.00 8.60% |
360.00 13.46% |
1167.00 13.44% |
225.00 13.07% |
| Printed Media | 250.00 1.71% |
187.00 1.87% |
63.00 1.38% |
179.00 1.48% |
44.00 4.85% |
45.00 1.68% |
163.00 1.88% |
27.00 1.57% |
| Remembered | 177.00 1.21% |
126.00 1.26% |
51.00 1.11% |
121.00 1.00% |
28.00 3.09% |
38.00 1.42% |
110.00 1.27% |
17.00 0.99% |
| Search Engine | 2143.00 14.69% |
1259.00 12.58% |
884.00 19.31% |
1682.00 13.94% |
156.00 17.20% |
464.00 17.35% |
1135.00 13.07% |
219.00 12.72% |
| Usenet News | 1198.00 8.21% |
879.00 8.78% |
319.00 6.97% |
1004.00 8.32% |
53.00 5.84% |
153.00 5.72% |
776.00 8.94% |
170.00 9.87% |
| WWW Page | 8297.00 56.88% |
5544.00 55.40% |
2753.00 60.14% |
6932.00 57.45% |
463.00 51.05% |
1521.00 56.88% |
4825.00 55.58% |
1056.00 61.32% |


GVU's WWW Surveying Team
Graphics, Visualization, & Usability Center
College of Computing
Georgia Institute of Technology
Atlanta, GA 30332-0280