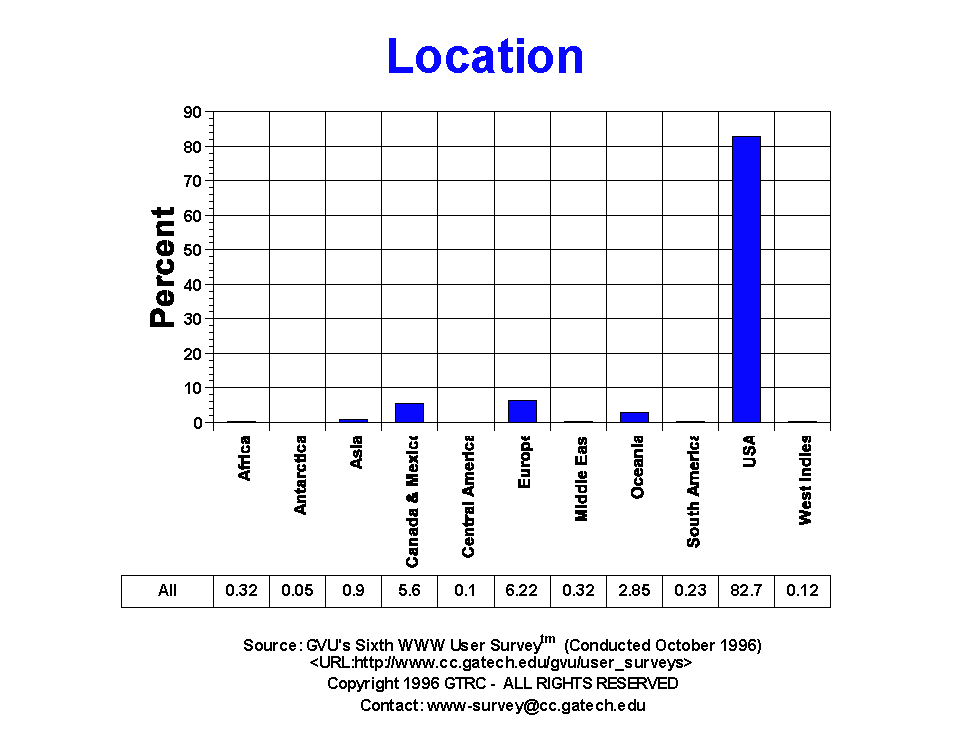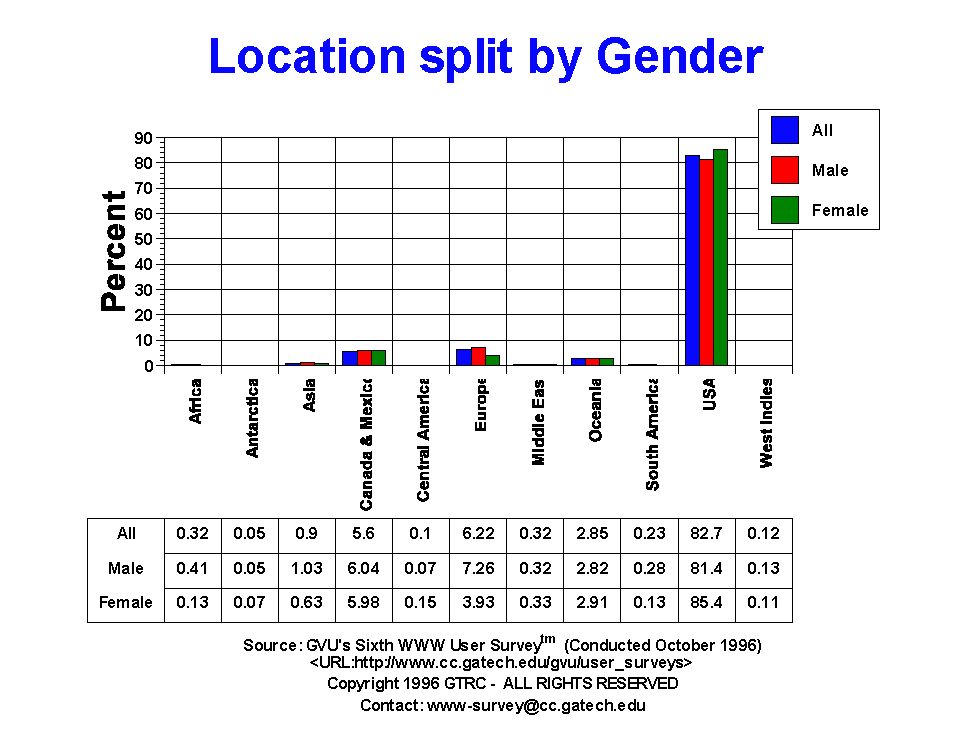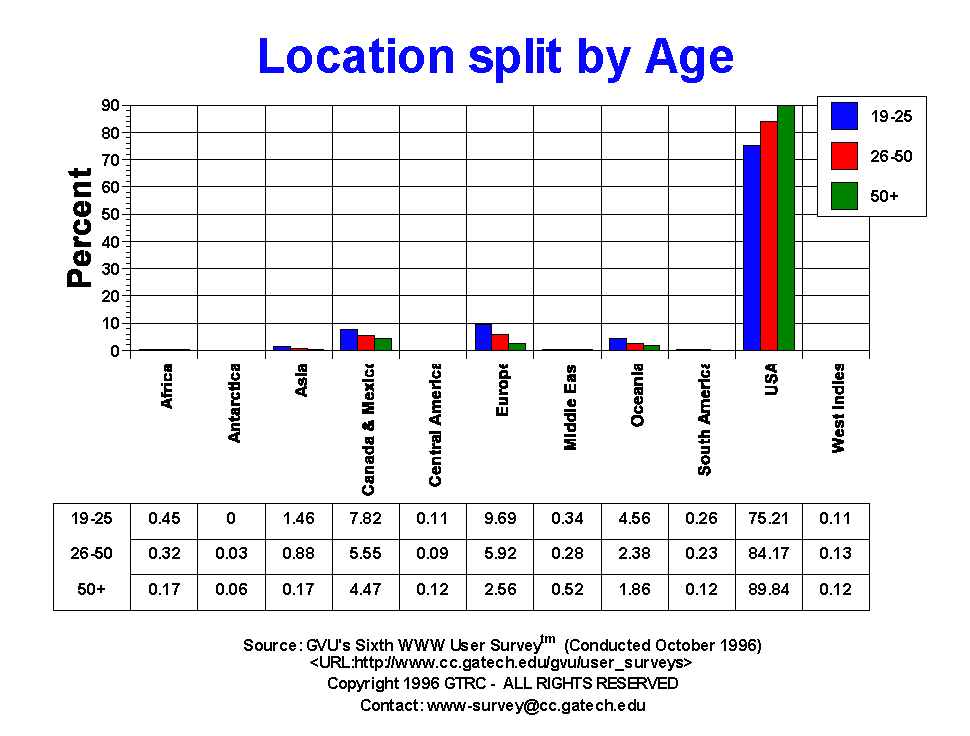

| Major Geographical Location | All | Male | Female | USA | Europe | 19-25 | 26-50 | 50+ |
| Africa | 47.00 0.32% |
41.00 0.41% |
6.00 0.13% |
0.00 0.00% |
0.00 0.00% |
12.00 0.45% |
28.00 0.32% |
3.00 0.17% |
| Antarctica | 8.00 0.05% |
5.00 0.05% |
3.00 0.07% |
0.00 0.00% |
0.00 0.00% |
0.00 0.00% |
3.00 0.03% |
1.00 0.06% |
| Asia | 132.00 0.90% |
103.00 1.03% |
29.00 0.63% |
0.00 0.00% |
0.00 0.00% |
39.00 1.46% |
76.00 0.88% |
3.00 0.17% |
| Canada & Mexico | 808.00 5.54% |
535.00 5.35% |
273.00 5.96% |
0.00 0.00% |
0.00 0.00% |
181.00 6.77% |
444.00 5.11% |
71.00 4.12% |
| Central America | 14.00 0.10% |
7.00 0.07% |
7.00 0.15% |
0.00 0.00% |
0.00 0.00% |
3.00 0.11% |
8.00 0.09% |
2.00 0.12% |
| Europe | 907.00 6.22% |
727.00 7.26% |
180.00 3.93% |
0.00 0.00% |
907.00 100.00% |
259.00 9.69% |
514.00 5.92% |
44.00 2.56% |
| Middle East | 47.00 0.32% |
32.00 0.32% |
15.00 0.33% |
0.00 0.00% |
0.00 0.00% |
9.00 0.34% |
24.00 0.28% |
9.00 0.52% |
| Oceania | 415.00 2.85% |
282.00 2.82% |
133.00 2.91% |
0.00 0.00% |
0.00 0.00% |
122.00 4.56% |
207.00 2.38% |
32.00 1.86% |
| South America | 34.00 0.23% |
28.00 0.28% |
6.00 0.13% |
0.00 0.00% |
0.00 0.00% |
7.00 0.26% |
20.00 0.23% |
2.00 0.12% |
| USA | 12067.00 82.73% |
8155.00 81.48% |
3912.00 85.45% |
12066.00 100.00% |
0.00 0.00% |
2011.00 75.21% |
7307.00 84.17% |
1547.00 89.84% |
| West Indies | 18.00 0.12% |
13.00 0.13% |
5.00 0.11% |
0.00 0.00% |
0.00 0.00% |
3.00 0.11% |
11.00 0.13% |
2.00 0.12% |


GVU's WWW Surveying Team
Graphics, Visualization, & Usability Center
College of Computing
Georgia Institute of Technology
Atlanta, GA 30332-0280