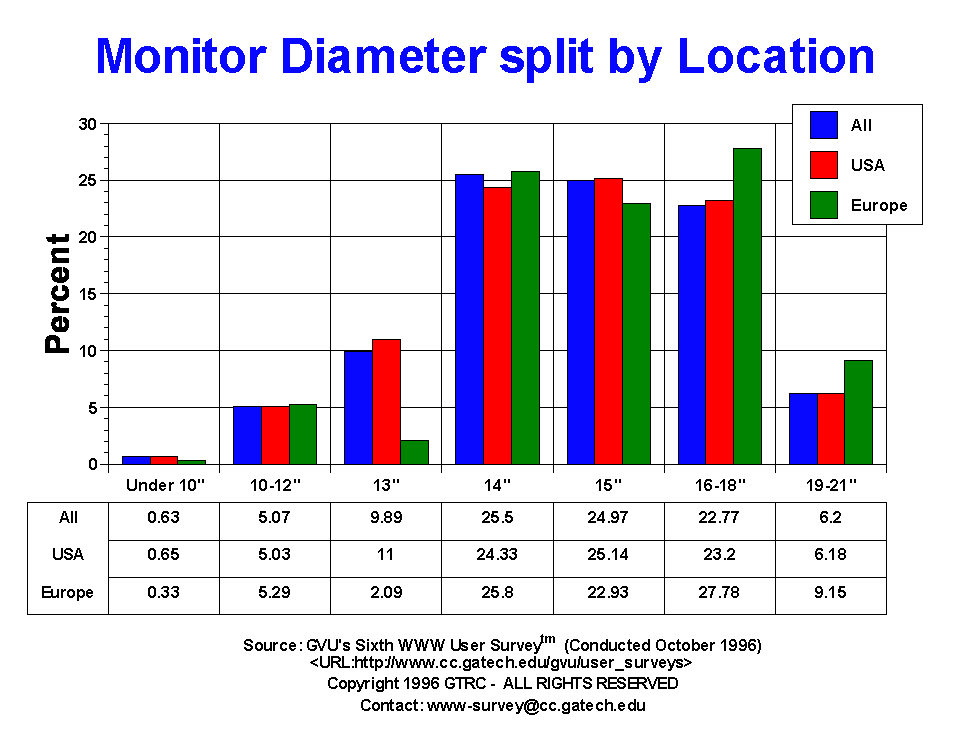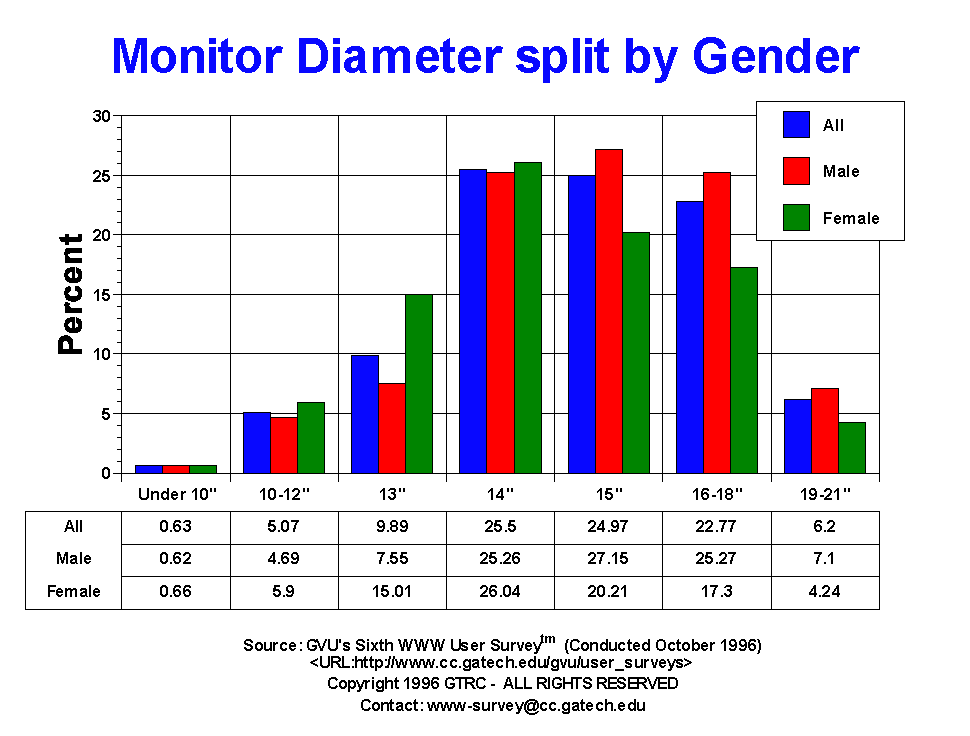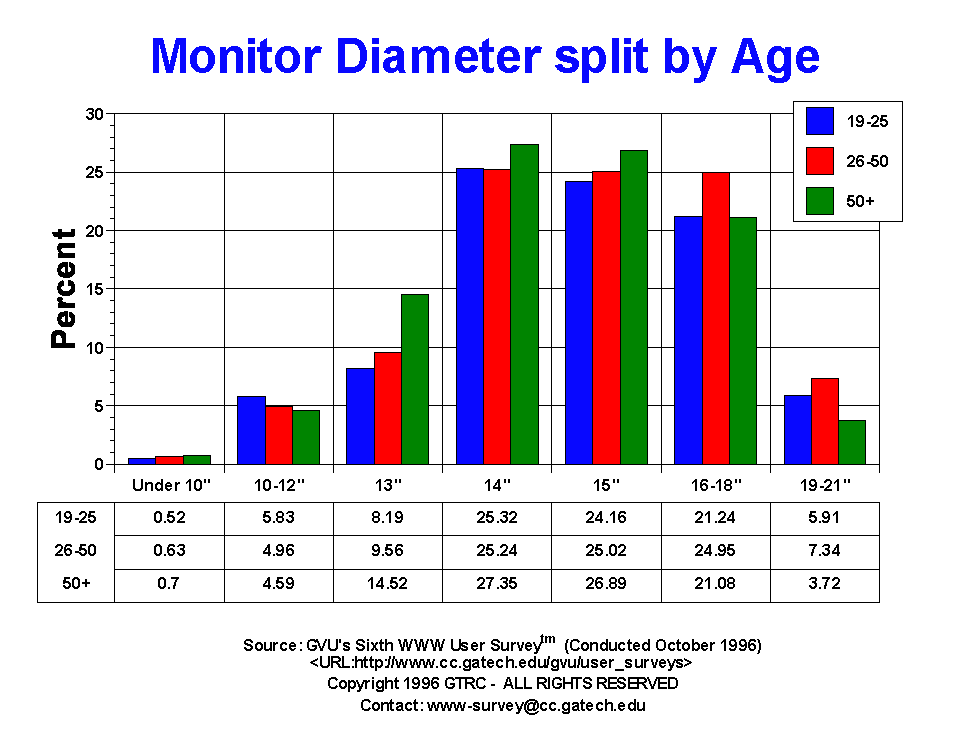

| Monitor Screen Size | All | Male | Female | USA | Europe | 19-25 | 26-50 | 50+ |
| 10-13 | 739.00 5.07% |
469.00 4.69% |
270.00 5.90% |
607.00 5.03% |
48.00 5.29% |
156.00 5.83% |
431.00 4.96% |
79.00 4.59% |
| 13 | 1443.00 9.89% |
756.00 7.55% |
687.00 15.01% |
1327.00 11.00% |
19.00 2.09% |
219.00 8.19% |
830.00 9.56% |
250.00 14.52% |
| 14 | 3720.00 25.50% |
2528.00 25.26% |
1192.00 26.04% |
2936.00 24.33% |
234.00 25.80% |
677.00 25.32% |
2191.00 25.24% |
471.00 27.35% |
| 15 | 3642.00 24.97% |
2717.00 27.15% |
925.00 20.21% |
3033.00 25.14% |
208.00 22.93% |
646.00 24.16% |
2172.00 25.02% |
463.00 26.89% |
| 16-18 | 3321.00 22.77% |
2529.00 25.27% |
792.00 17.30% |
2799.00 23.20% |
252.00 27.78% |
568.00 21.24% |
2166.00 24.95% |
363.00 21.08% |
| 19-21 | 905.00 6.20% |
711.00 7.10% |
194.00 4.24% |
746.00 6.18% |
83.00 9.15% |
158.00 5.91% |
637.00 7.34% |
64.00 3.72% |
| Don't Know | 640.00 4.39% |
183.00 1.83% |
457.00 9.98% |
479.00 3.97% |
53.00 5.84% |
221.00 8.26% |
153.00 1.76% |
12.00 0.70% |
| Other | 8.00 0.05% |
4.00 0.04% |
4.00 0.09% |
4.00 0.03% |
1.00 0.11% |
0.00 0.00% |
4.00 0.05% |
1.00 0.06% |
| Over 22 | 76.00 0.52% |
49.00 0.49% |
27.00 0.59% |
57.00 0.47% |
6.00 0.66% |
15.00 0.56% |
42.00 0.48% |
7.00 0.41% |
| Under 10 | 92.00 0.63% |
62.00 0.62% |
30.00 0.66% |
78.00 0.65% |
3.00 0.33% |
14.00 0.52% |
55.00 0.63% |
12.00 0.70% |


GVU's WWW Surveying Team
Graphics, Visualization, & Usability Center
College of Computing
Georgia Institute of Technology
Atlanta, GA 30332-0280