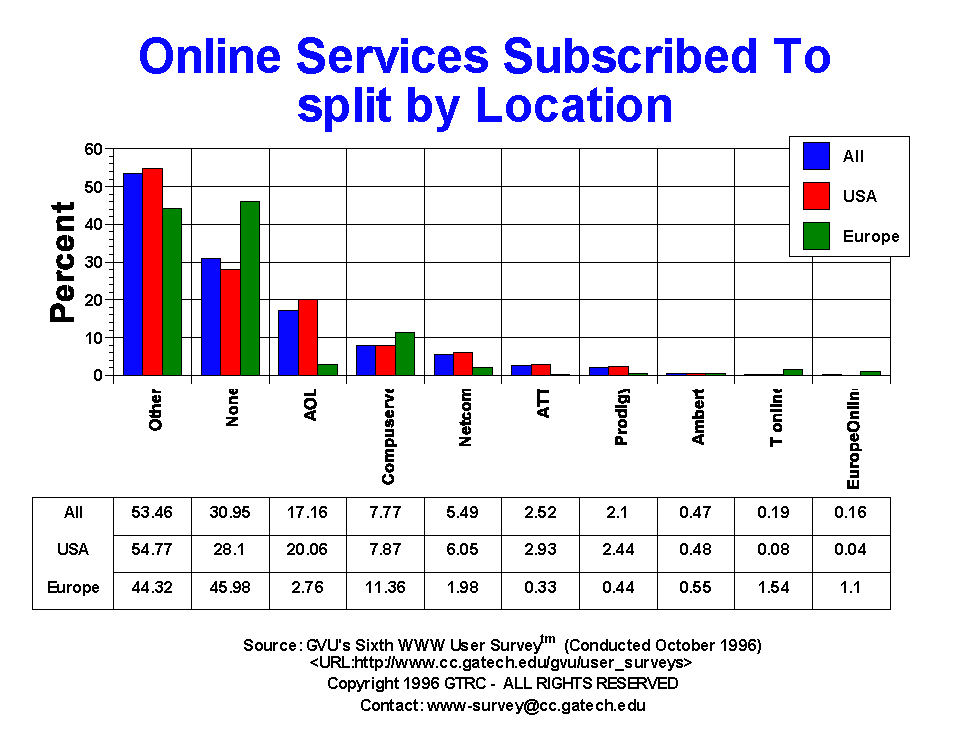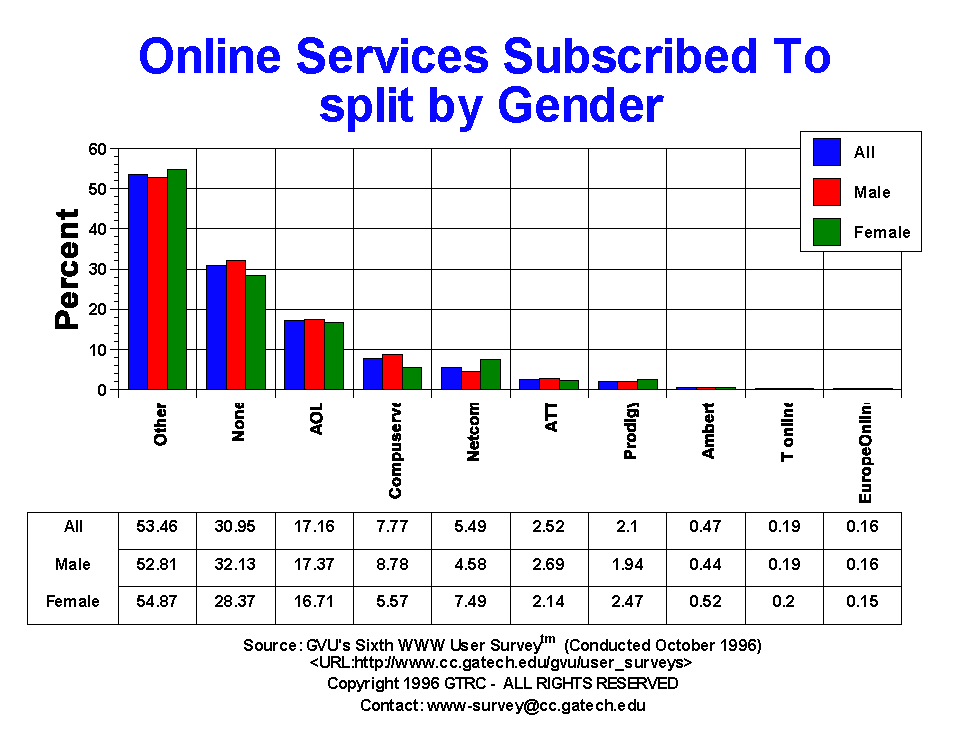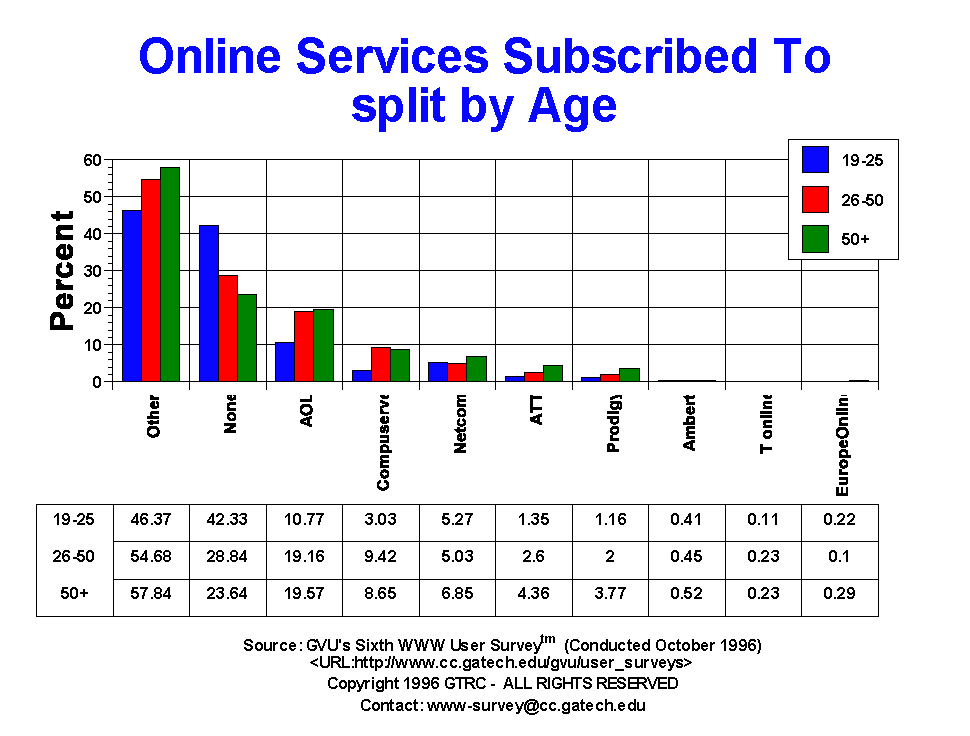

| Online Services Subscribed To | All | Male | Female | USA | Europe | 19-25 | 26-50 | 50+ |
| AOL | 2503.00 17.16% |
1738.00 17.37% |
765.00 16.71% |
2421.00 20.06% |
25.00 2.76% |
288.00 10.77% |
1663.00 19.16% |
337.00 19.57% |
| ATT | 367.00 2.52% |
269.00 2.69% |
98.00 2.14% |
353.00 2.93% |
3.00 0.33% |
36.00 1.35% |
226.00 2.60% |
75.00 4.36% |
| Ambert | 68.00 0.47% |
44.00 0.44% |
24.00 0.52% |
58.00 0.48% |
5.00 0.55% |
11.00 0.41% |
39.00 0.45% |
9.00 0.52% |
| Compuserve | 1134.00 7.77% |
879.00 8.78% |
255.00 5.57% |
949.00 7.87% |
103.00 11.36% |
81.00 3.03% |
818.00 9.42% |
149.00 8.65% |
| EuropeOnline | 23.00 0.16% |
16.00 0.16% |
7.00 0.15% |
5.00 0.04% |
10.00 1.10% |
6.00 0.22% |
9.00 0.10% |
5.00 0.29% |
| Netcom | 801.00 5.49% |
458.00 4.58% |
343.00 7.49% |
730.00 6.05% |
18.00 1.98% |
141.00 5.27% |
437.00 5.03% |
118.00 6.85% |
| None | 4515.00 30.95% |
3216.00 32.13% |
1299.00 28.37% |
3390.00 28.10% |
417.00 45.98% |
1132.00 42.33% |
2504.00 28.84% |
407.00 23.64% |
| Other | 7797.00 53.46% |
5285.00 52.81% |
2512.00 54.87% |
6608.00 54.77% |
402.00 44.32% |
1240.00 46.37% |
4747.00 54.68% |
996.00 57.84% |
| Prodigy | 307.00 2.10% |
194.00 1.94% |
113.00 2.47% |
295.00 2.44% |
4.00 0.44% |
31.00 1.16% |
174.00 2.00% |
65.00 3.77% |
| T online | 28.00 0.19% |
19.00 0.19% |
9.00 0.20% |
10.00 0.08% |
14.00 1.54% |
3.00 0.11% |
20.00 0.23% |
4.00 0.23% |


GVU's WWW Surveying Team
Graphics, Visualization, & Usability Center
College of Computing
Georgia Institute of Technology
Atlanta, GA 30332-0280