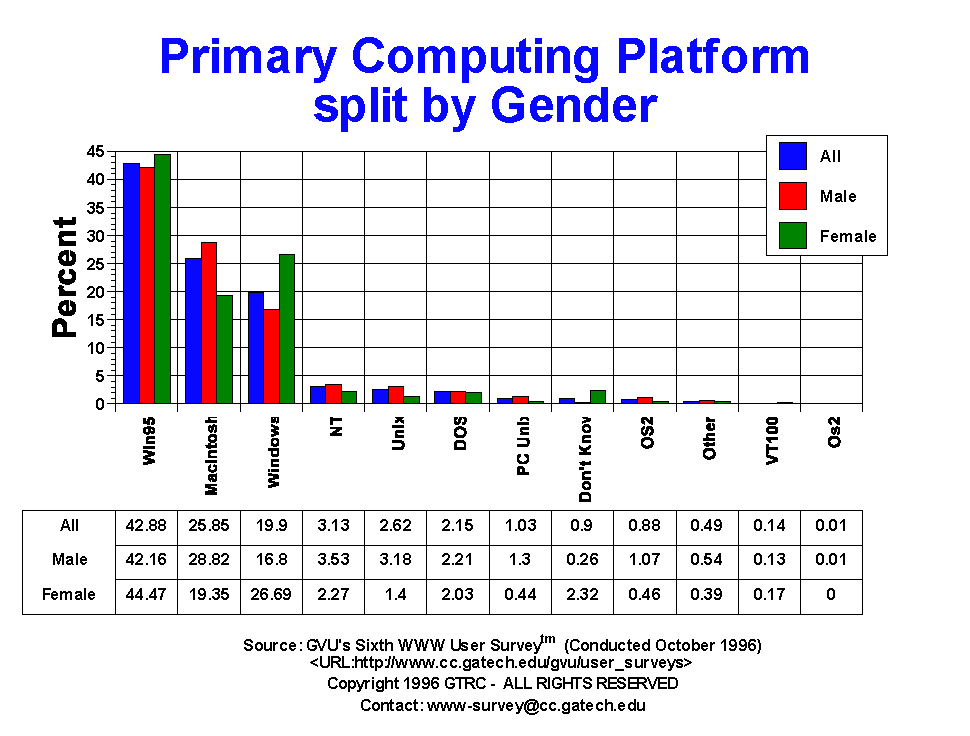

| Primary Computing Platform | All | Male | Female | USA | Europe | 19-25 | 26-50 | 50+ |
| DOS | 314.00 2.15% |
221.00 2.21% |
93.00 2.03% |
244.00 2.02% |
17.00 1.87% |
65.00 2.43% |
142.00 1.64% |
39.00 2.26% |
| Don't Know | 132.00 0.90% |
26.00 0.26% |
106.00 2.32% |
104.00 0.86% |
12.00 1.32% |
45.00 1.68% |
18.00 0.21% |
4.00 0.23% |
| Macintosh | 3770.00 25.85% |
2884.00 28.82% |
886.00 19.35% |
3215.00 26.65% |
200.00 22.05% |
624.00 23.34% |
2476.00 28.52% |
390.00 22.65% |
| NT | 457.00 3.13% |
353.00 3.53% |
104.00 2.27% |
364.00 3.02% |
50.00 5.51% |
108.00 4.04% |
288.00 3.32% |
25.00 1.45% |
| OS2 | 128.00 0.88% |
107.00 1.07% |
21.00 0.46% |
94.00 0.78% |
20.00 2.21% |
30.00 1.12% |
74.00 0.85% |
14.00 0.81% |
| Other | 72.00 0.49% |
54.00 0.54% |
18.00 0.39% |
47.00 0.39% |
14.00 1.54% |
18.00 0.67% |
34.00 0.39% |
8.00 0.46% |
| PC Unix | 150.00 1.03% |
130.00 1.30% |
20.00 0.44% |
105.00 0.87% |
26.00 2.87% |
53.00 1.98% |
63.00 0.73% |
4.00 0.23% |
| Unix | 382.00 2.62% |
318.00 3.18% |
64.00 1.40% |
275.00 2.28% |
63.00 6.95% |
108.00 4.04% |
231.00 2.66% |
17.00 0.99% |
| VT100 | 21.00 0.14% |
13.00 0.13% |
8.00 0.17% |
17.00 0.14% |
1.00 0.11% |
6.00 0.22% |
9.00 0.10% |
4.00 0.23% |
| Win95 | 6255.00 42.88% |
4219.00 42.16% |
2036.00 44.47% |
5251.00 43.52% |
321.00 35.39% |
1166.00 43.61% |
3634.00 41.86% |
779.00 45.24% |
| Windows | 2903.00 19.90% |
1681.00 16.80% |
1222.00 26.69% |
2348.00 19.46% |
183.00 20.18% |
450.00 16.83% |
1712.00 19.72% |
438.00 25.44% |


GVU's WWW Surveying Team
Graphics, Visualization, & Usability Center
College of Computing
Georgia Institute of Technology
Atlanta, GA 30332-0280