
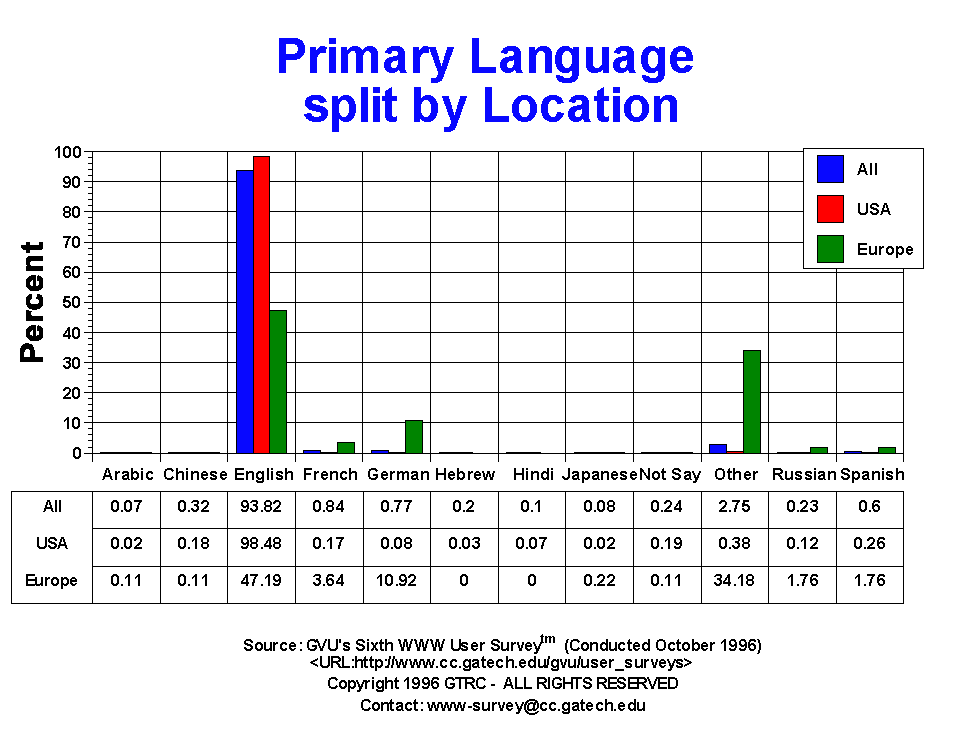
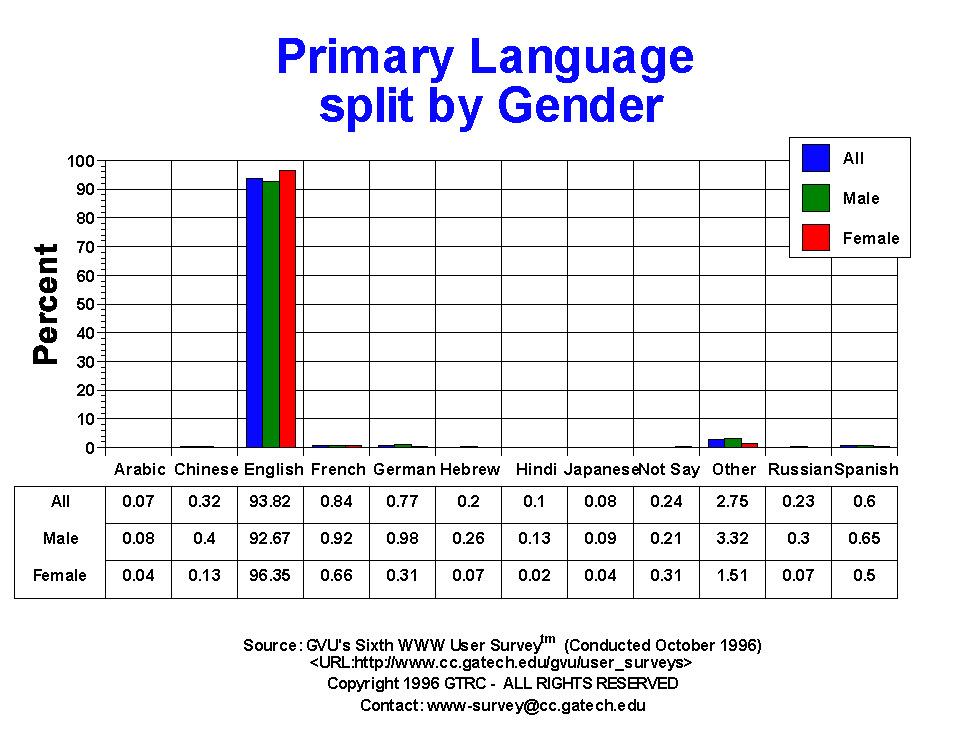
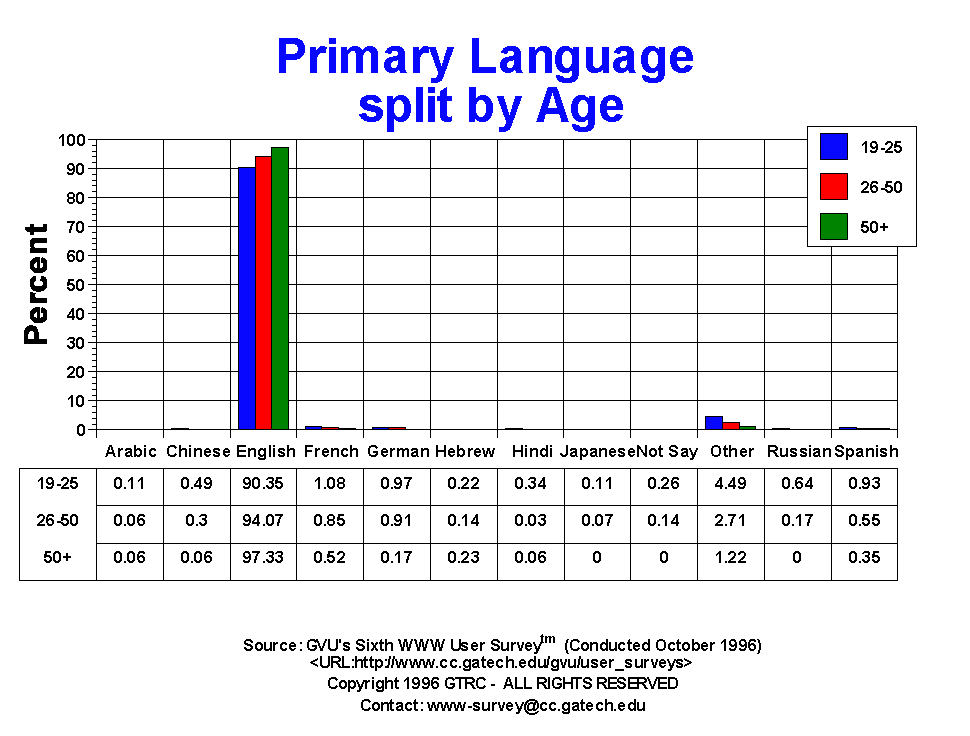
| Primary Language | All | Male | Female | USA | Europe | 19-25 | 26-50 | 50+ |
| Arabic | 10.00 0.07% |
8.00 0.08% |
2.00 0.04% |
2.00 0.02% |
1.00 0.11% |
3.00 0.11% |
5.00 0.06% |
1.00 0.06% |
| Chinese | 46.00 0.32% |
40.00 0.40% |
6.00 0.13% |
22.00 0.18% |
1.00 0.11% |
13.00 0.49% |
26.00 0.30% |
1.00 0.06% |
| English | 13685.00 93.82% |
9274.00 92.67% |
4411.00 96.35% |
11883.00 98.48% |
428.00 47.19% |
2416.00 90.35% |
8166.00 94.07% |
1676.00 97.33% |
| French | 122.00 0.84% |
92.00 0.92% |
30.00 0.66% |
20.00 0.17% |
33.00 3.64% |
29.00 1.08% |
74.00 0.85% |
9.00 0.52% |
| German | 112.00 0.77% |
98.00 0.98% |
14.00 0.31% |
10.00 0.08% |
99.00 10.92% |
26.00 0.97% |
79.00 0.91% |
3.00 0.17% |
| Hebrew | 29.00 0.20% |
26.00 0.26% |
3.00 0.07% |
4.00 0.03% |
0.00 0.00% |
6.00 0.22% |
12.00 0.14% |
4.00 0.23% |
| Hindi | 14.00 0.10% |
13.00 0.13% |
1.00 0.02% |
8.00 0.07% |
0.00 0.00% |
9.00 0.34% |
3.00 0.03% |
1.00 0.06% |
| Japanese | 11.00 0.08% |
9.00 0.09% |
2.00 0.04% |
3.00 0.02% |
2.00 0.22% |
3.00 0.11% |
6.00 0.07% |
0.00 0.00% |
| Not Say | 35.00 0.24% |
21.00 0.21% |
14.00 0.31% |
23.00 0.19% |
1.00 0.11% |
7.00 0.26% |
12.00 0.14% |
0.00 0.00% |
| Other | 401.00 2.75% |
332.00 3.32% |
69.00 1.51% |
46.00 0.38% |
310.00 34.18% |
120.00 4.49% |
235.00 2.71% |
21.00 1.22% |
| Russian | 33.00 0.23% |
30.00 0.30% |
3.00 0.07% |
14.00 0.12% |
16.00 1.76% |
17.00 0.64% |
15.00 0.17% |
0.00 0.00% |
| Spanish | 88.00 0.60% |
65.00 0.65% |
23.00 0.50% |
31.00 0.26% |
16.00 1.76% |
25.00 0.93% |
48.00 0.55% |
6.00 0.35% |
GVU's WWW Surveying Team
Graphics, Visualization, & Usability Center
College of Computing
Georgia Institute of Technology
Atlanta, GA 30332-0280