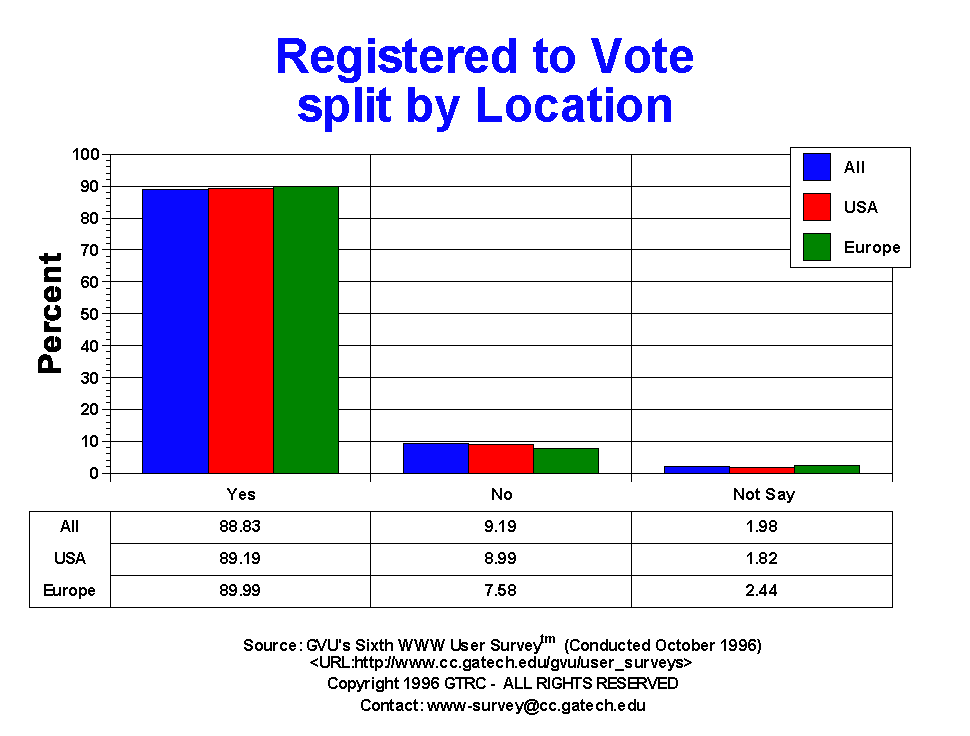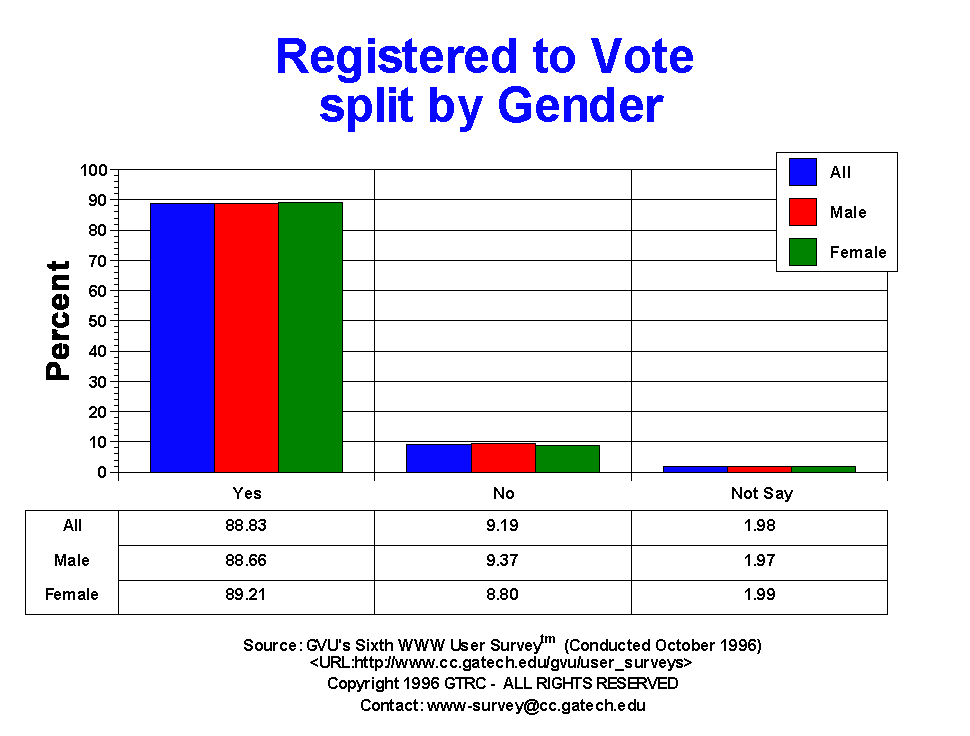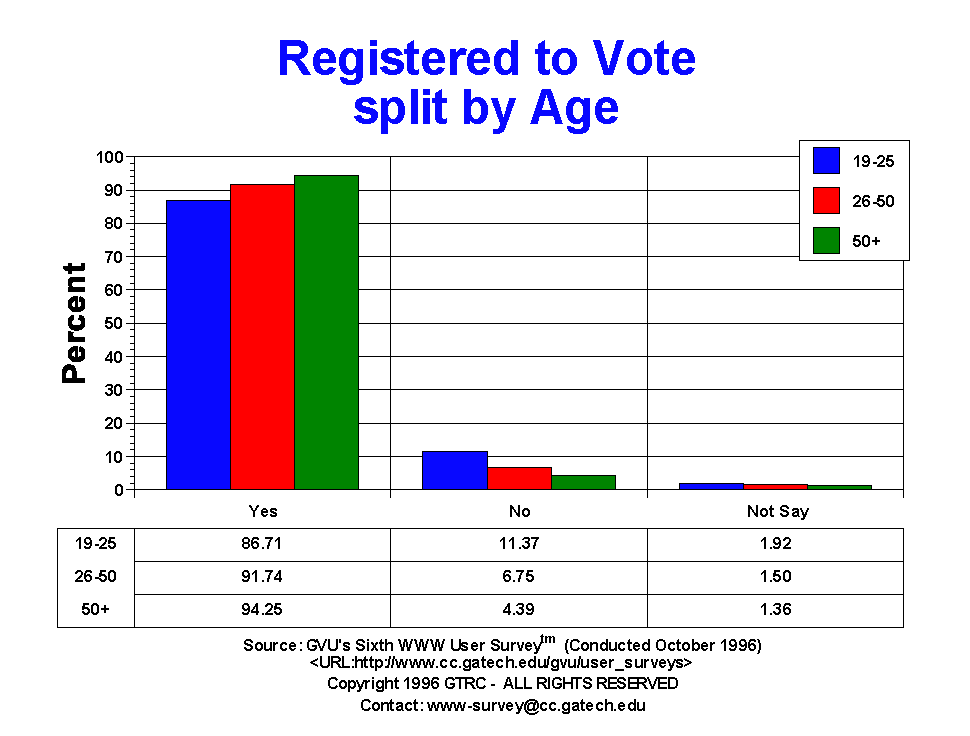

| Registered to Vote | All | Male | Female | USA | Europe | 19-25 | 26-50 | 50+ |
| No | 1245.00 8.54% |
869.00 8.68% |
376.00 8.21% |
1034.00 8.57% |
56.00 6.17% |
290.00 10.85% |
561.00 6.46% |
74.00 4.30% |
| Not Applicable | 1038.00 7.12% |
733.00 7.32% |
305.00 6.66% |
565.00 4.68% |
168.00 18.52% |
123.00 4.60% |
375.00 4.32% |
36.00 2.09% |
| Not Say | 268.00 1.84% |
183.00 1.83% |
85.00 1.86% |
209.00 1.73% |
18.00 1.98% |
49.00 1.83% |
125.00 1.44% |
23.00 1.34% |
| Yes | 12035.00 82.51% |
8223.00 82.16% |
3812.00 83.27% |
10258.00 85.02% |
665.00 73.32% |
2212.00 82.72% |
7620.00 87.78% |
1589.00 92.28% |


GVU's WWW Surveying Team
Graphics, Visualization, & Usability Center
College of Computing
Georgia Institute of Technology
Atlanta, GA 30332-0280