
| Community Building | All | Male | Female | USA | Europe | 19-25 | 26-50 | 50+ |
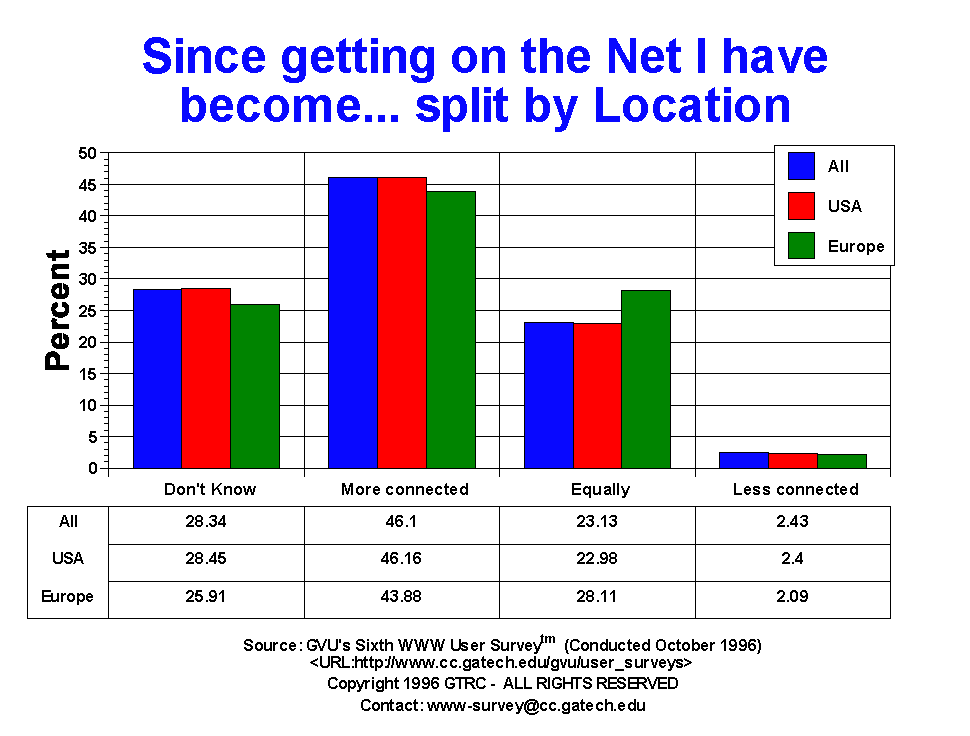
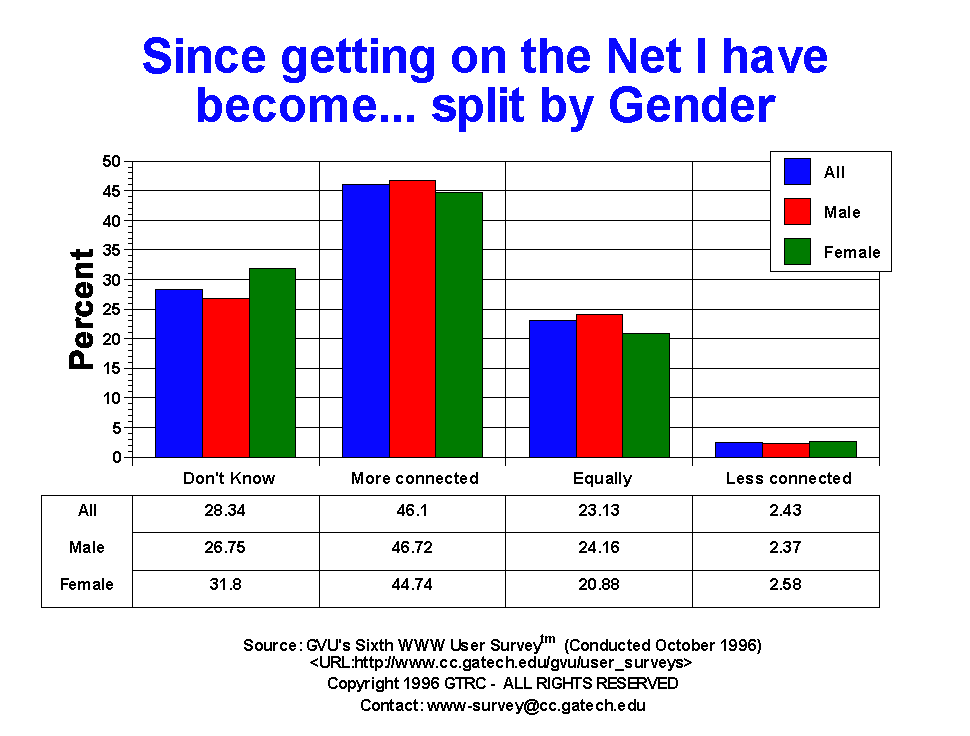
| Don't Know | 4133.00 28.34% |
2677.00 26.75% |
1456.00 31.80% |
3433.00 28.45% |
235.00 25.91% |
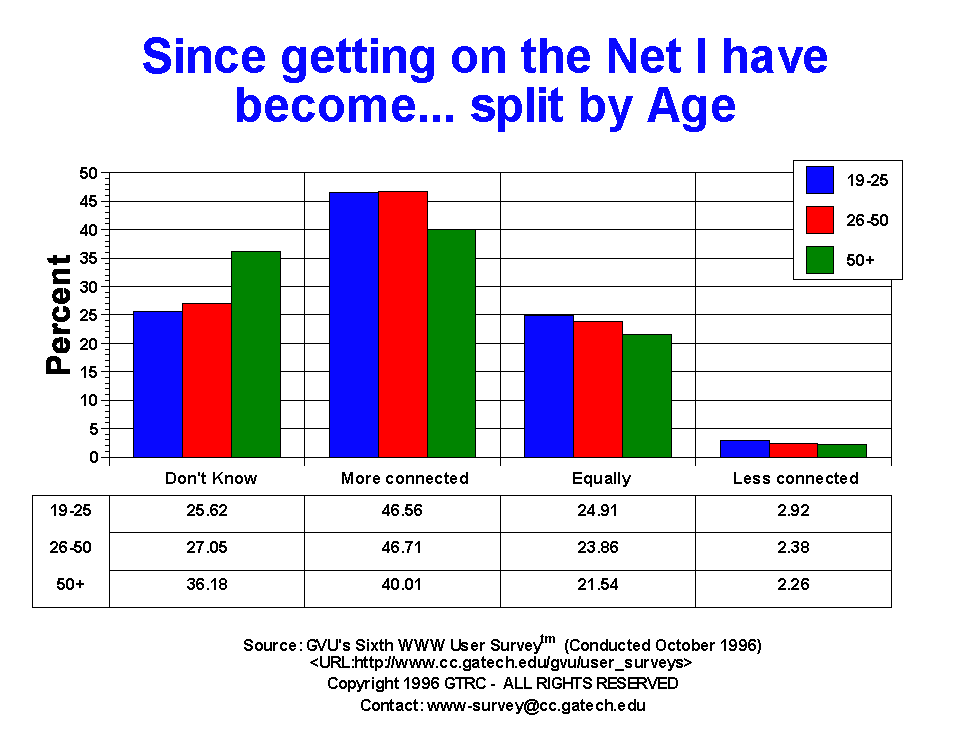
685.00 25.62% |
2348.00 27.05% |
623.00 36.18% |
| Equally | 3374.00 23.13% |
2418.00 24.16% |
956.00 20.88% |
2773.00 22.98% |
255.00 28.11% |
666.00 24.91% |
2071.00 23.86% |
371.00 21.54% |
| Less | 355.00 2.43% |
237.00 2.37% |
118.00 2.58% |
290.00 2.40% |
19.00 2.09% |
78.00 2.92% |
207.00 2.38% |
39.00 2.26% |
| More | 6724.00 46.10% |
4676.00 46.72% |
2048.00 44.74% |
5570.00 46.16% |
398.00 43.88% |
1245.00 46.56% |
4055.00 46.71% |
689.00 40.01% |


GVU's WWW Surveying Team
Graphics, Visualization, & Usability Center
College of Computing
Georgia Institute of Technology
Atlanta, GA 30332-0280