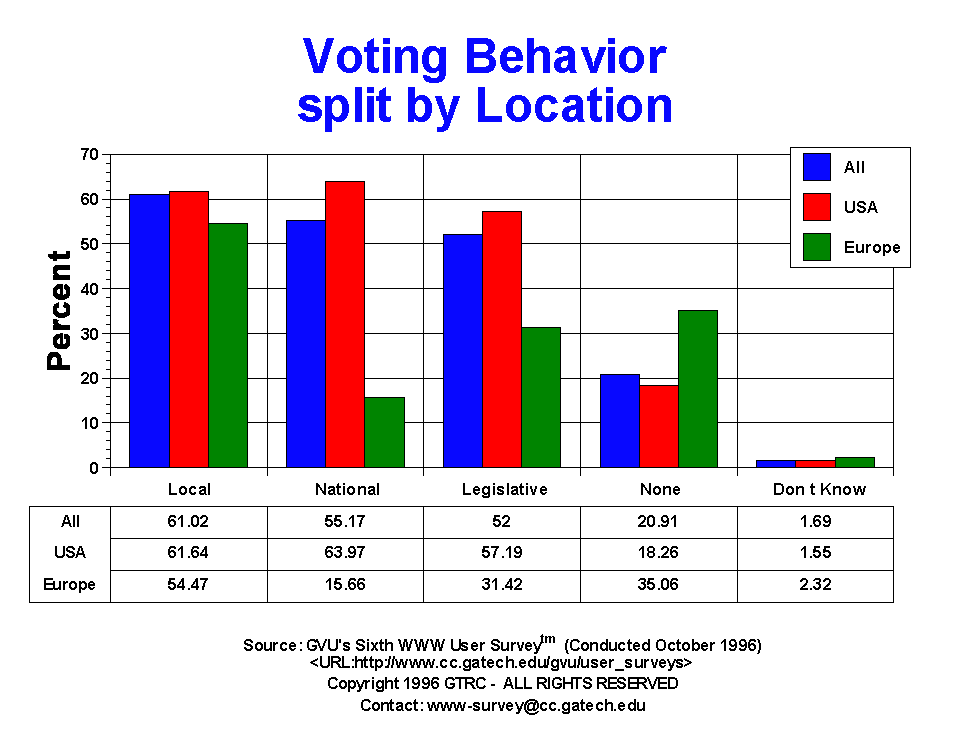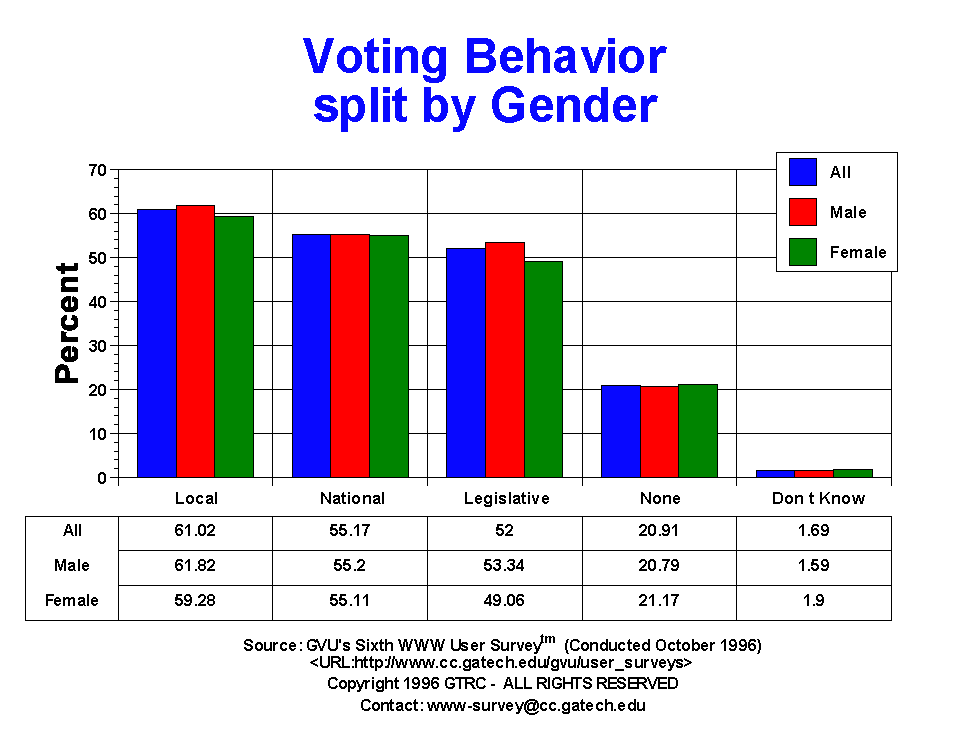

| Voting Behavior | All | Male | Female | USA | Europe | 19-25 | 26-50 | 50+ |
| Don t Know | 246.00 1.69% |
159.00 1.59% |
87.00 1.90% |
187.00 1.55% |
21.00 2.32% |
51.00 1.91% |
146.00 1.68% |
24.00 1.39% |
| Legislative | 7584.00 52.00% |
5338.00 53.34% |
2246.00 49.06% |
6900.00 57.19% |
285.00 31.42% |
924.00 34.55% |
5176.00 59.62% |
1278.00 74.22% |
| Local | 8901.00 61.02% |
6187.00 61.82% |
2714.00 59.28% |
7438.00 61.64% |
494.00 54.47% |
1341.00 50.15% |
5827.00 67.12% |
1405.00 81.59% |
| National | 8047.00 55.17% |
5524.00 55.20% |
2523.00 55.11% |
7719.00 63.97% |
142.00 15.66% |
1000.00 37.40% |
5567.00 64.13% |
1256.00 72.94% |
| None | 3050.00 20.91% |
2081.00 20.79% |
969.00 21.17% |
2203.00 18.26% |
318.00 35.06% |
750.00 28.05% |
1071.00 12.34% |
124.00 7.20% |


GVU's WWW Surveying Team
Graphics, Visualization, & Usability Center
College of Computing
Georgia Institute of Technology
Atlanta, GA 30332-0280