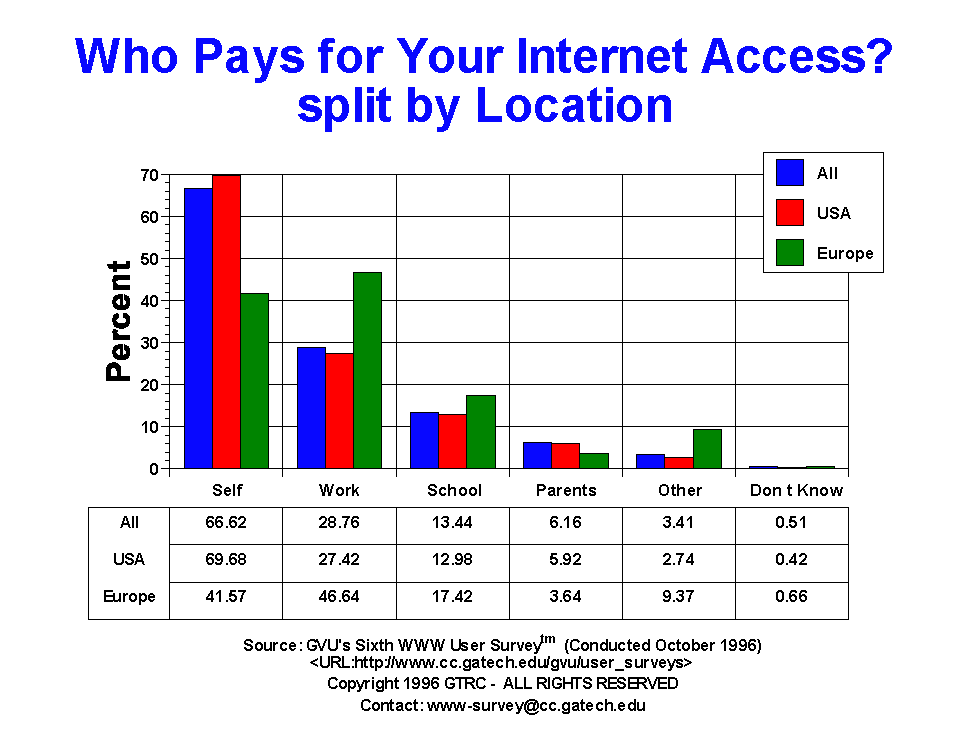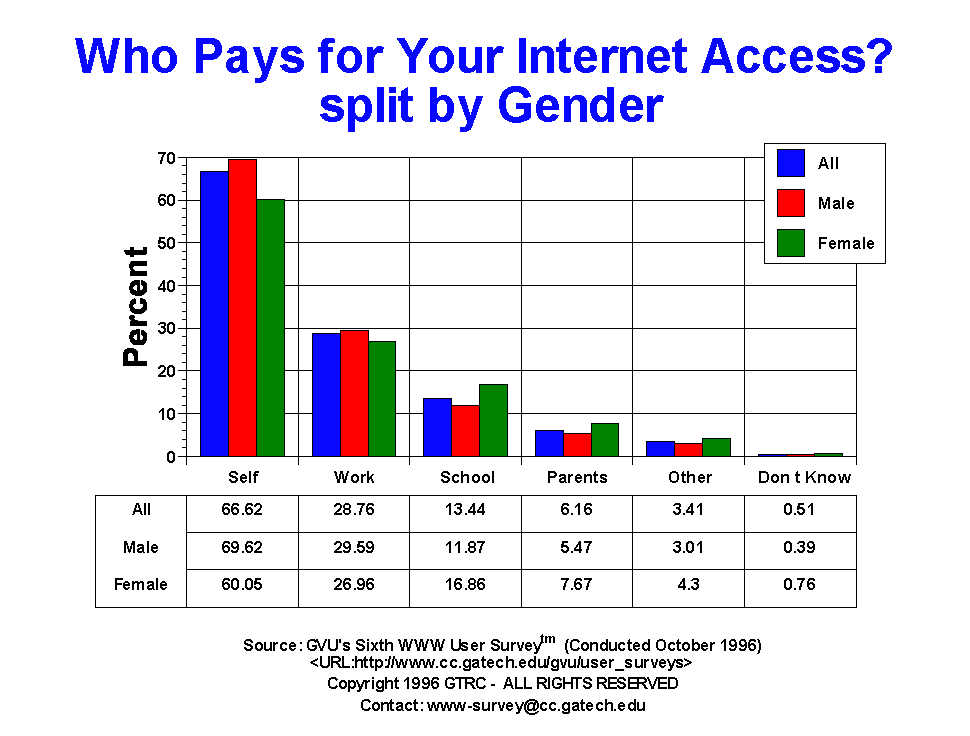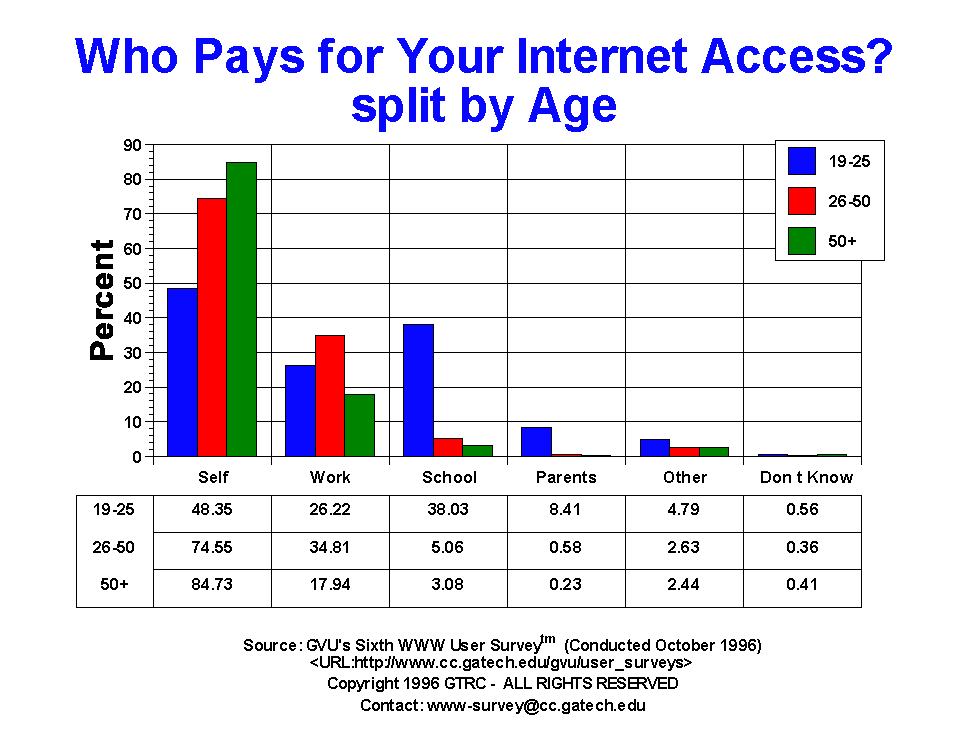

| Who Pays for Access | All | Male | Female | USA | Europe | 19-25 | 26-50 | 50+ |
| Don t Know | 74.00 0.51% |
39.00 0.39% |
35.00 0.76% |
51.00 0.42% |
6.00 0.66% |
15.00 0.56% |
31.00 0.36% |
7.00 0.41% |
| Other | 498.00 3.41% |
301.00 3.01% |
197.00 4.30% |
331.00 2.74% |
85.00 9.37% |
128.00 4.79% |
228.00 2.63% |
42.00 2.44% |
| Parents | 898.00 6.16% |
547.00 5.47% |
351.00 7.67% |
714.00 5.92% |
33.00 3.64% |
225.00 8.41% |
50.00 0.58% |
4.00 0.23% |
| School | 1960.00 13.44% |
1188.00 11.87% |
772.00 16.86% |
1566.00 12.98% |
158.00 17.42% |
1017.00 38.03% |
439.00 5.06% |
53.00 3.08% |
| Self | 9717.00 66.62% |
6968.00 69.62% |
2749.00 60.05% |
8408.00 69.68% |
377.00 41.57% |
1293.00 48.35% |
6472.00 74.55% |
1459.00 84.73% |
| Work | 4195.00 28.76% |
2961.00 29.59% |
1234.00 26.96% |
3308.00 27.42% |
423.00 46.64% |
701.00 26.22% |
3022.00 34.81% |
309.00 17.94% |


GVU's WWW Surveying Team
Graphics, Visualization, & Usability Center
College of Computing
Georgia Institute of Technology
Atlanta, GA 30332-0280