
| Willingness to Pay Fees | All | Male | Female | USA | Europe | 19-25 | 26-50 | 50+ |
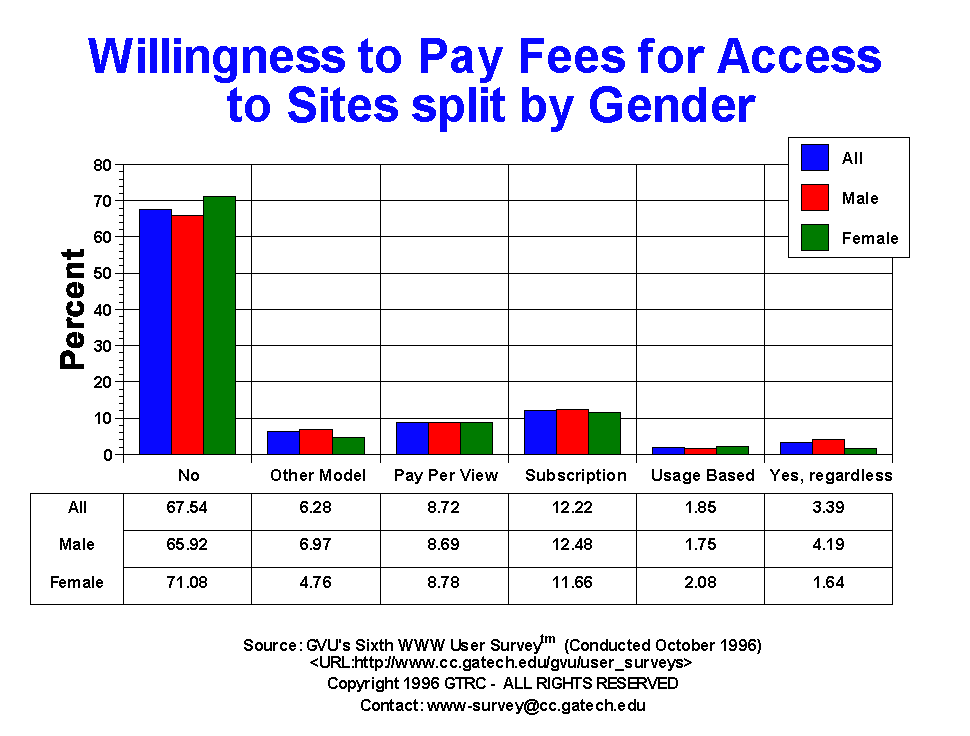
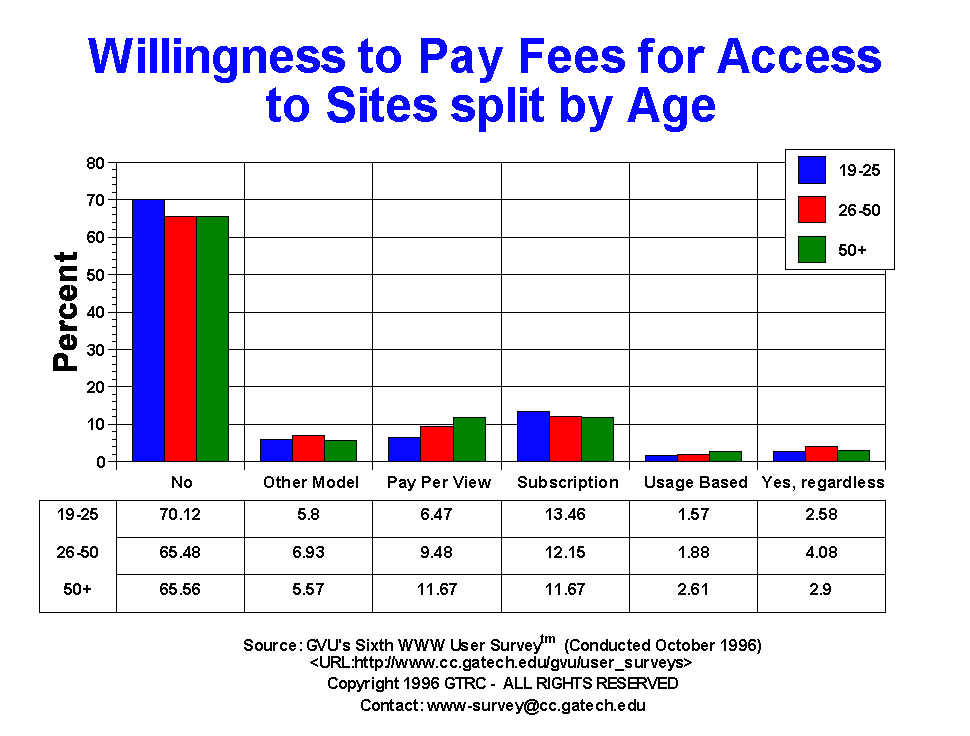
| No | 9851.00 67.54% |
6597.00 65.92% |
3254.00 71.08% |
8194.00 67.91% |
564.00 62.18% |
1875.00 70.12% |
5684.00 65.48% |
1129.00 65.56% |
| Other | 916.00 6.28% |
698.00 6.97% |
218.00 4.76% |
738.00 6.12% |
70.00 7.72% |
155.00 5.80% |
602.00 6.93% |
96.00 5.57% |
| Pay Per View | 1272.00 8.72% |
870.00 8.69% |
402.00 8.78% |
1022.00 8.47% |
98.00 10.80% |
173.00 6.47% |
823.00 9.48% |
201.00 11.67% |
| Subscription | 1783.00 12.22% |
1249.00 12.48% |
534.00 11.66% |
1534.00 12.71% |
100.00 11.03% |
360.00 13.46% |
1055.00 12.15% |
201.00 11.67% |
| Usage | 270.00 1.85% |
175.00 1.75% |
95.00 2.08% |
196.00 1.62% |
23.00 2.54% |
42.00 1.57% |
163.00 1.88% |
45.00 2.61% |
| Yes, regardless | 494.00 3.39% |
419.00 4.19% |
75.00 1.64% |
382.00 3.17% |
52.00 5.73% |
69.00 2.58% |
354.00 4.08% |
50.00 2.90% |


GVU's WWW Surveying Team
Graphics, Visualization, & Usability Center
College of Computing
Georgia Institute of Technology
Atlanta, GA 30332-0280