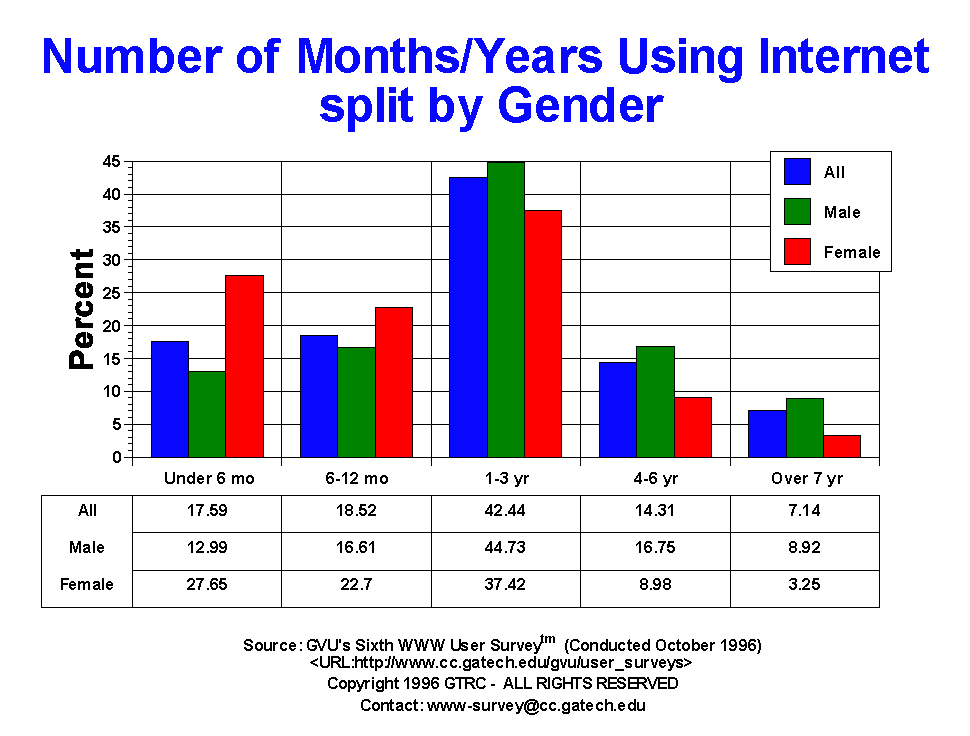
Years On Internet
Notes:
- The continued migration of users to the Internet is still seen in the Sixth Survey,
where 36.11% of the users have gone online in the past year, though this is down from
43.1% of respondents in the Fifth Survey (April 1996), 60.3% in the Fourth (Oct 1995), and 50.21%
in the Third (April 1995).
Close to half of the users have now been online between 1 and 3 years (42.44%), with 14.31%
between 4 and 6 years and 7.14% for over 7 years. Note that the more experienced user percentages
are nearly identical to the Fifth Survey (14.13% 4-6 yrs and 7.86% 7+ yrs). This longitudinal
data shows the clear bump of when the Internet began to gain wide acceptance in 1994 and 1995.
- In Surveys past, European users typically have been on the Internet for more years,
the Sixth Survey marks the first time more European users have only been online for less than 6 months
than their US counterparts (16.81%). This may be the beginning of the European rush!
- Female users still are flocking to the Internet, with half (50.35%) having gone online in the
past year, compared to only 29.6% for males. Though as is seen in the overall decline of new users
percentage wise, females with under 6 months experience has declined to 27.65% in the Sixth Survey,
down from 33.97 in the Fifth, 36.8% in the Fourth, and 39.5% in the Third Surveys. The over 50 yr old
age group of users is also showing signs of slow-down in new users, with only 48.26% having gone online
in the past year compared to 55.86% in the Fifth Survey.
Table of Data for All Categories
| Years on Internet |
All |
Male |
Female |
USA |
Europe |
19-25 |
26-50 |
50+ |
| 1-3 yr |
6190.00 42.44% |
4477.00 44.73% |
1713.00 37.42% |
5188.00 43.00% |
371.00 40.90% |
1222.00 45.70% |
3711.00 42.75% |
670.00 38.91% |
| 4-6 yr |
2087.00 14.31% |
1676.00 16.75% |
411.00 8.98% |
1762.00 14.60% |
126.00 13.89% |
606.00 22.66% |
1199.00 13.81% |
151.00 8.77% |
| 6-12 mo |
2701.00 18.52% |
1662.00 16.61% |
1039.00 22.70% |
2221.00 18.41% |
148.00 16.32% |
365.00 13.65% |
1621.00 18.67% |
426.00 24.74% |
| Over 7 yr |
1042.00 7.14% |
893.00 8.92% |
149.00 3.25% |
867.00 7.19% |
76.00 8.38% |
99.00 3.70% |
831.00 9.57% |
70.00 4.07% |
| Under 6 mo |
2566.00 17.59% |
1300.00 12.99% |
1266.00 27.65% |
2028.00 16.81% |
186.00 20.51% |
382.00 14.29% |
1319.00 15.19% |
405.00 23.52% |


For more information or to submit comments:
send e-mail to www-survey@cc.gatech.edu.
GVU's WWW Surveying Team
Graphics, Visualization, & Usability Center
College of Computing
Georgia Institute of Technology
Atlanta, GA 30332-0280


