
| Hours Spend on Political Material | All | Male | Female | USA | Europe | 19-25 | 26-50 | 50+ |
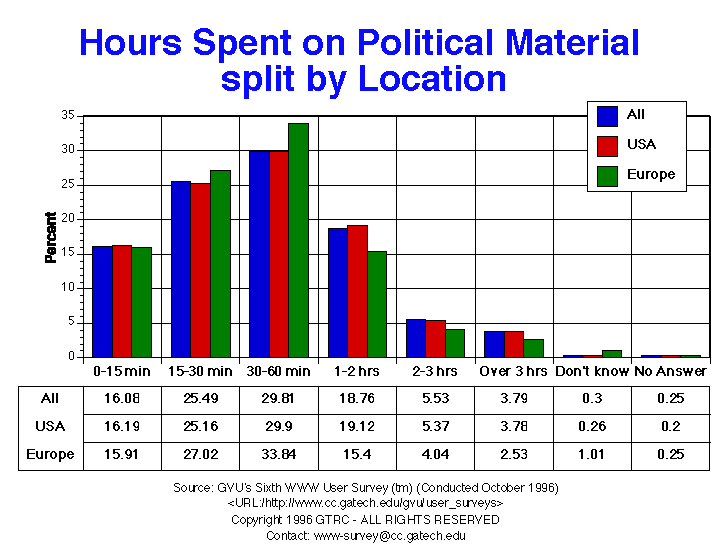
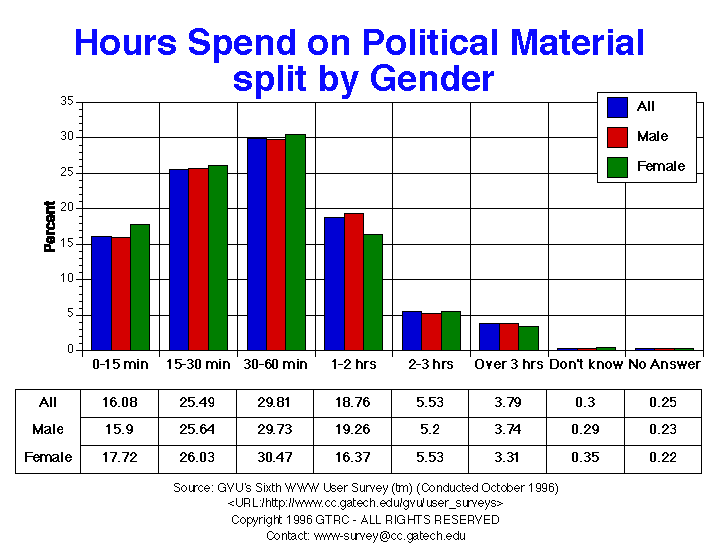
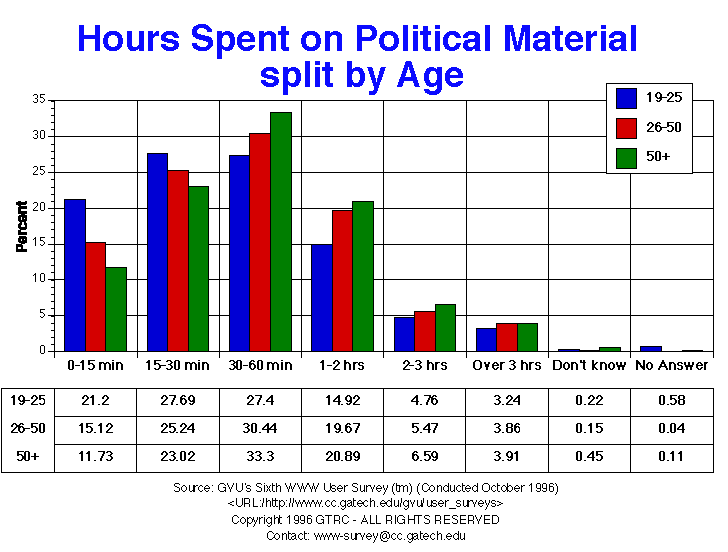
| 1-2 hrs | 1505.00 18.76% |
1003.00 19.26% |
376.00 16.37% |
1228.00 19.12% |
61.00 15.40% |
207.00 14.92% |
896.00 19.67% |
187.00 20.89% |
| 15-30 min | 2045.00 25.49% |
1335.00 25.64% |
598.00 26.03% |
1616.00 25.16% |
107.00 27.02% |
384.00 27.69% |
1150.00 25.24% |
206.00 23.02% |
| 2-3 hrs | 444.00 5.53% |
271.00 5.20% |
127.00 5.53% |
345.00 5.37% |
16.00 4.04% |
66.00 4.76% |
249.00 5.47% |
59.00 6.59% |
| 30-60 min | 2392.00 29.81% |
1548.00 29.73% |
700.00 30.47% |
1920.00 29.90% |
134.00 33.84% |
380.00 27.40% |
1387.00 30.44% |
298.00 33.30% |
| Don't know | 24.00 0.30% |
15.00 0.29% |
8.00 0.35% |
17.00 0.26% |
4.00 1.01% |
3.00 0.22% |
7.00 0.15% |
4.00 0.45% |
| Less than 15 min | 1290.00 16.08% |
828.00 15.90% |
407.00 17.72% |
1040.00 16.19% |
63.00 15.91% |
294.00 21.20% |
689.00 15.12% |
105.00 11.73% |
| No Answer | 20.00 0.25% |
12.00 0.23% |
5.00 0.22% |
13.00 0.20% |
1.00 0.25% |
8.00 0.58% |
2.00 0.04% |
1.00 0.11% |
| Over 3 hrs | 304.00 3.79% |
195.00 3.74% |
76.00 3.31% |
243.00 3.78% |
10.00 2.53% |
45.00 3.24% |
176.00 3.86% |
35.00 3.91% |


GVU's WWW Surveying Team
Graphics, Visualization, & Usability Center
College of Computing
Georgia Institute of Technology
Atlanta, GA 30332-0280