
| Involvement with Issues | All | Male | Female | USA | Europe | 19-25 | 26-50 | 50+ |
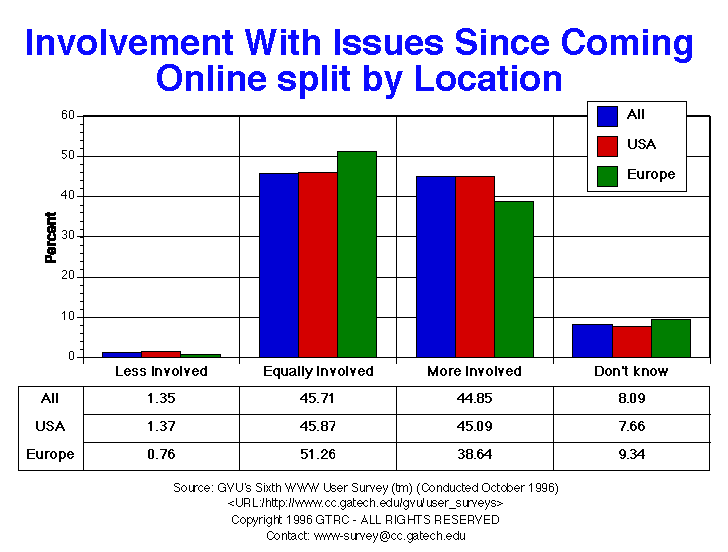
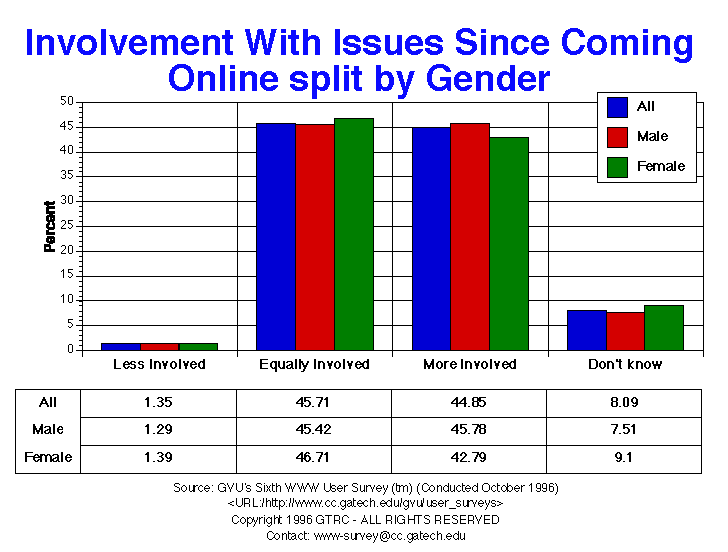
| Don't know | 649.00 8.09% |
391.00 7.51% |
209.00 9.10% |
492.00 7.66% |
37.00 9.34% |
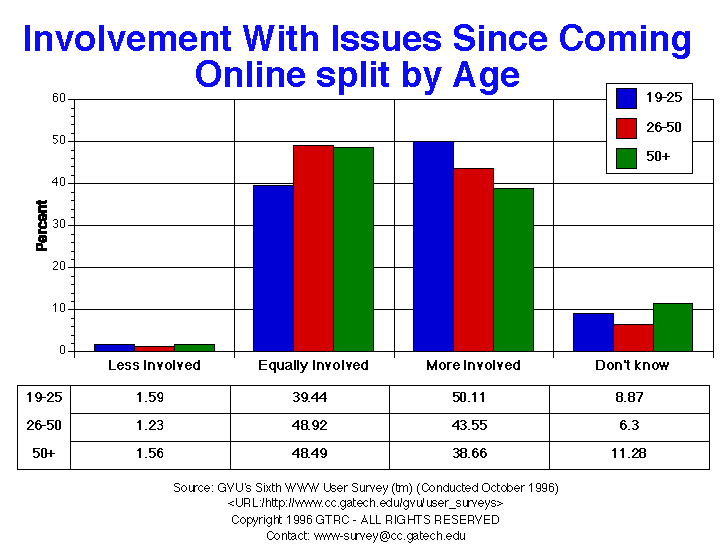
123.00 8.87% |
287.00 6.30% |
101.00 11.28% |
| Equally Involved | 3668.00 45.71% |
2365.00 45.42% |
1073.00 46.71% |
2946.00 45.87% |
203.00 51.26% |
547.00 39.44% |
2229.00 48.92% |
434.00 48.49% |
| Less Involved | 108.00 1.35% |
67.00 1.29% |
32.00 1.39% |
88.00 1.37% |
3.00 0.76% |
22.00 1.59% |
56.00 1.23% |
14.00 1.56% |
| More Involved | 3599.00 44.85% |
2384.00 45.78% |
983.00 42.79% |
2896.00 45.09% |
153.00 38.64% |
695.00 50.11% |
1984.00 43.55% |
346.00 38.66% |


GVU's WWW Surveying Team
Graphics, Visualization, & Usability Center
College of Computing
Georgia Institute of Technology
Atlanta, GA 30332-0280