Attitudes Towards Spamming
Notes:
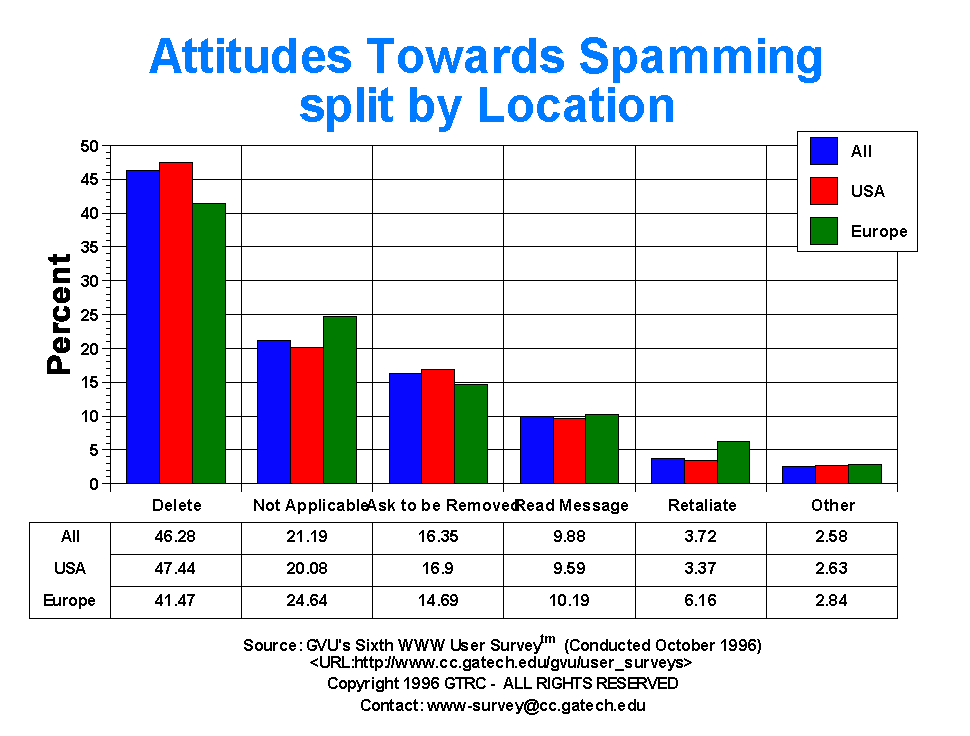
- How exactly do people deal with unsolicited mass emailings (aka SPAM)? Turns out that the most popular
response to being spammed is to simply delete the message, an action which 46.28% of the people apparently
do. Surprisingly, one in five people claim that they have never received any mass emailings (these people
probably do not post to usenet news, a popular feeding ground for spammers). A significant number of
people reply back to the sender requesting to be removed from future mailings. Only 9.88% actually read
the message, a number which may surprise those entities that send the messages. Close to 4% of
the people claim to retaliate in one form or another (mail bombs, denial-of-service attacks, etc.).
- While there is less spamming in Europe (24.64% claim never to have been spammed), nearly twice as many
Europeans retaliate when spammed (6.16%). Gender differences also exist, with over 30% of women claiming
never to have been spammed compared to only 17% for men. This might be reflective of the bias towards
male-focused products and services on the Web. As one might expect, the elder generation deletes more
spam and retaliate less than the younger generation (49.83% 50+ delete vs 43.40% 19-25 and 1.49% 50+ retaliate
vs 5.34% 19-25). This trend towards lack of acceptance of spamming among the younger generations
does not paint a nice picture for the future of spammers.
Table of Data for All Categories
| Attitudes Towards Spamming |
All |
Male |
Female |
USA |
Europe |
19-25 |
26-50 |
50+ |
| Delete |
3481.00 46.28% |
2402.00 47.57% |
979.00 43.41% |
2885.00 47.44% |
175.00 41.47% |
585.00 43.40% |
2116.00 47.93% |
434.00 49.83% |
| Not App |
1594.00 21.19% |
871.00 17.25% |
677.00 30.02% |
1221.00 20.08% |
104.00 24.64% |
260.00 19.29% |
903.00 20.45% |
202.00 23.19% |
| Other |
194.00 2.58% |
145.00 2.87% |
40.00 1.77% |
160.00 2.63% |
12.00 2.84% |
40.00 2.97% |
107.00 2.42% |
15.00 1.72% |
| Read |
743.00 9.88% |
480.00 9.51% |
241.00 10.69% |
583.00 9.59% |
43.00 10.19% |
169.00 12.54% |
374.00 8.47% |
80.00 9.18% |
| Reply |
1230.00 16.35% |
909.00 18.00% |
289.00 12.82% |
1028.00 16.90% |
62.00 14.69% |
222.00 16.47% |
773.00 17.51% |
127.00 14.58% |
| Retaliate |
280.00 3.72% |
242.00 4.79% |
29.00 1.29% |
205.00 3.37% |
26.00 6.16% |
72.00 5.34% |
142.00 3.22% |
13.00 1.49% |


For more information or to submit comments:
send e-mail to www-survey@cc.gatech.edu.
GVU's WWW Surveying Team
Graphics, Visualization, & Usability Center
College of Computing
Georgia Institute of Technology
Atlanta, GA 30332-0280


