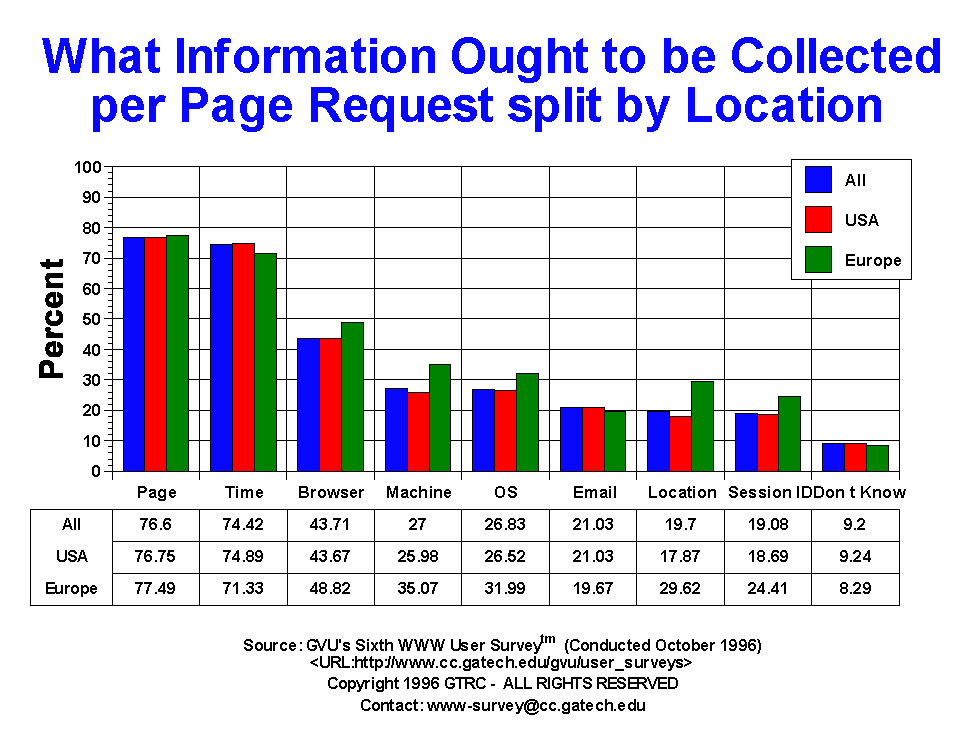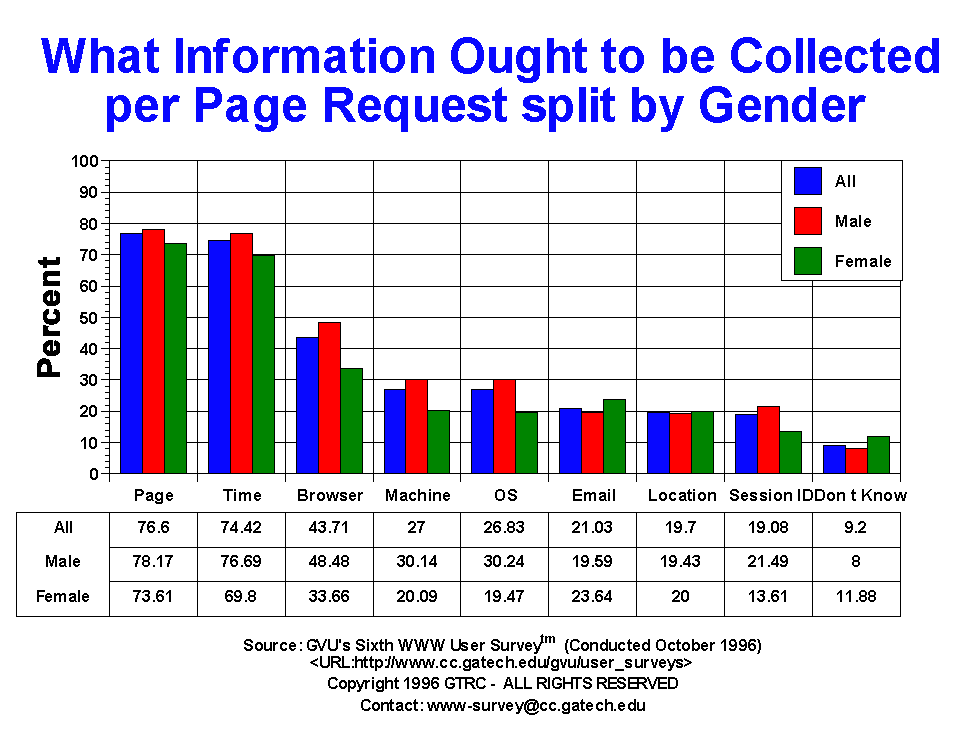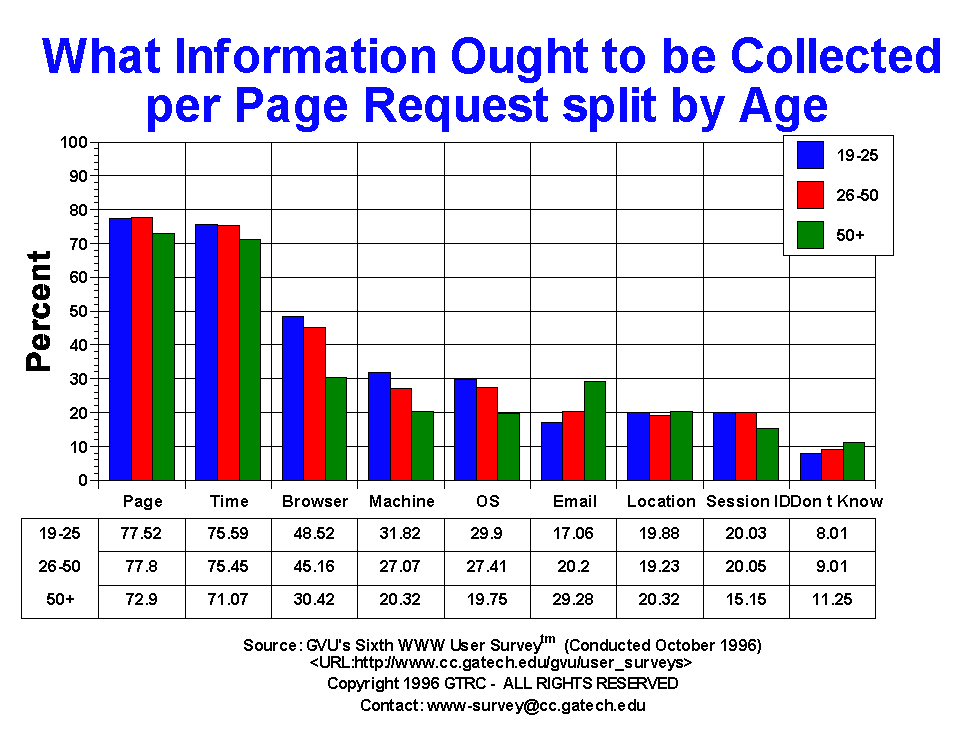

| What Information Ought to be Collected per Page Request | All | Male | Female | USA | Europe | 19-25 | 26-50 | 50+ |
| Don t Know | 692.00 9.20% |
404.00 8.00% |
268.00 11.88% |
562.00 9.24% |
35.00 8.29% |
108.00 8.01% |
398.00 9.01% |
98.00 11.25% |
| Email Address | 1582.00 21.03% |
989.00 19.59% |
533.00 23.64% |
1279.00 21.03% |
83.00 19.67% |
230.00 17.06% |
892.00 20.20% |
255.00 29.28% |
| Location | 1482.00 19.70% |
981.00 19.43% |
451.00 20.00% |
1087.00 17.87% |
125.00 29.62% |
268.00 19.88% |
849.00 19.23% |
177.00 20.32% |
| Machine | 2031.00 27.00% |
1522.00 30.14% |
453.00 20.09% |
1580.00 25.98% |
148.00 35.07% |
429.00 31.82% |
1195.00 27.07% |
177.00 20.32% |
| OS | 2018.00 26.83% |
1527.00 30.24% |
439.00 19.47% |
1613.00 26.52% |
135.00 31.99% |
403.00 29.90% |
1210.00 27.41% |
172.00 19.75% |
| Requested Page | 5762.00 76.60% |
3947.00 78.17% |
1660.00 73.61% |
4668.00 76.75% |
327.00 77.49% |
1045.00 77.52% |
3435.00 77.80% |
635.00 72.90% |
| Session ID | 1435.00 19.08% |
1085.00 21.49% |
307.00 13.61% |
1137.00 18.69% |
103.00 24.41% |
270.00 20.03% |
885.00 20.05% |
132.00 15.15% |
| Time of Request | 5598.00 74.42% |
3872.00 76.69% |
1574.00 69.80% |
4555.00 74.89% |
301.00 71.33% |
1019.00 75.59% |
3331.00 75.45% |
619.00 71.07% |
| Which Browser | 3288.00 43.71% |
2448.00 48.48% |
759.00 33.66% |
2656.00 43.67% |
206.00 48.82% |
654.00 48.52% |
1994.00 45.16% |
265.00 30.42% |


GVU's WWW Surveying Team
Graphics, Visualization, & Usability Center
College of Computing
Georgia Institute of Technology
Atlanta, GA 30332-0280