
| Browser You Expect to Use in 12 Months | All | Male | Female | USA | Europe | 19-25 | 26-50 | 50+ |
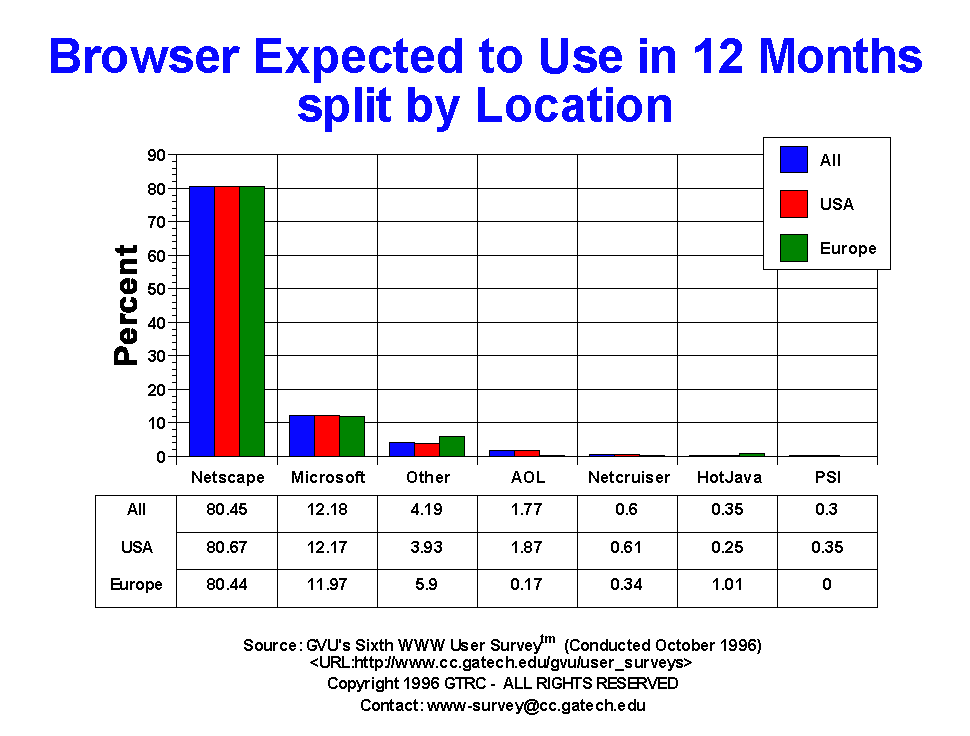
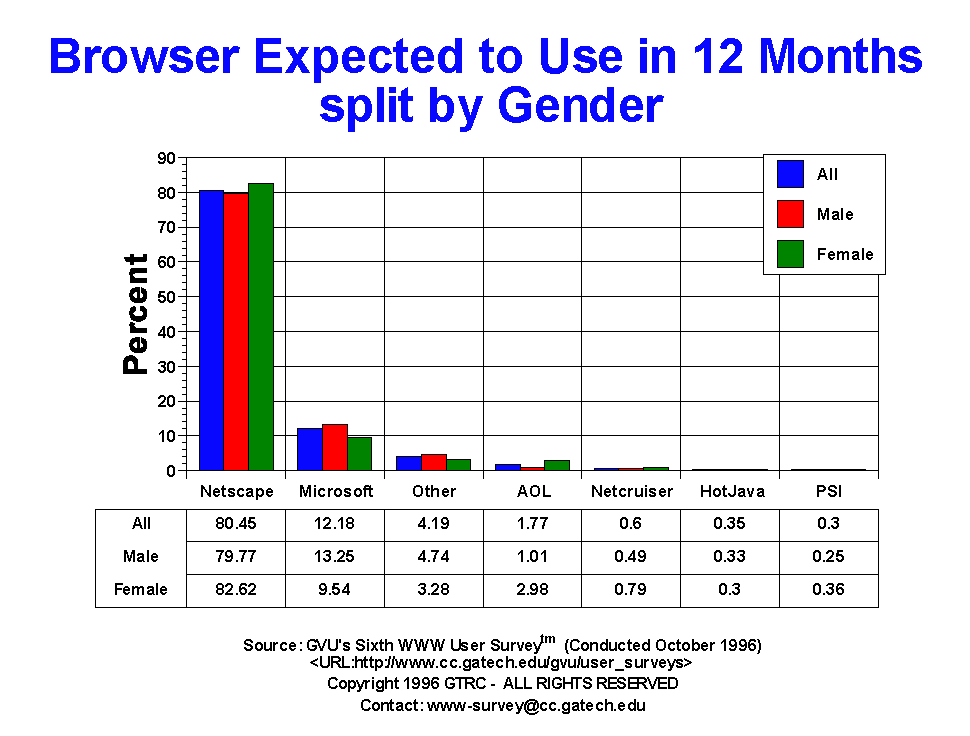
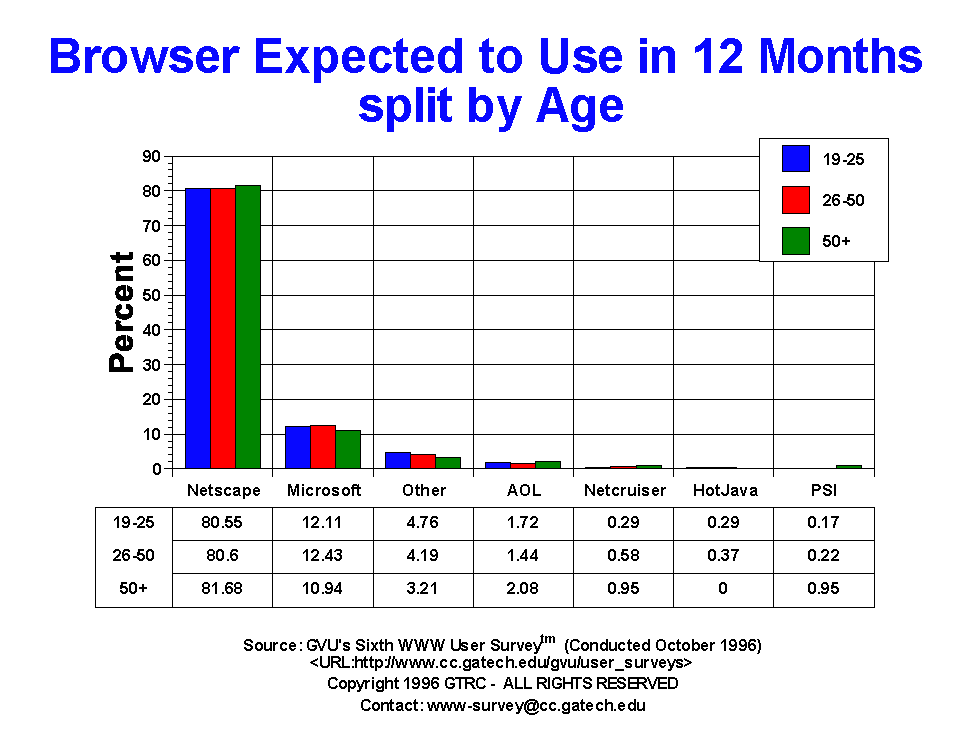
| AOL | 183.00 1.77% |
68.00 1.01% |
91.00 2.98% |
151.00 1.87% |
1.00 0.17% |
30.00 1.72% |
86.00 1.44% |
24.00 2.08% |
| HotJava | 36.00 0.35% |
22.00 0.33% |
9.00 0.30% |
20.00 0.25% |
6.00 1.01% |
5.00 0.29% |
22.00 0.37% |
0.00 0.00% |
| Microsoft | 1258.00 12.18% |
889.00 13.25% |
291.00 9.54% |
984.00 12.17% |
71.00 11.97% |
211.00 12.11% |
744.00 12.43% |
126.00 10.94% |
| Netcruiser | 62.00 0.60% |
33.00 0.49% |
24.00 0.79% |
49.00 0.61% |
2.00 0.34% |
5.00 0.29% |
35.00 0.58% |
11.00 0.95% |
| Netscape | 8311.00 80.45% |
5350.00 79.77% |
2520.00 82.62% |
6523.00 80.67% |
477.00 80.44% |
1404.00 80.55% |
4824.00 80.60% |
941.00 81.68% |
| Other | 433.00 4.19% |
318.00 4.74% |
100.00 3.28% |
318.00 3.93% |
35.00 5.90% |
83.00 4.76% |
251.00 4.19% |
37.00 3.21% |
| PSI | 31.00 0.30% |
17.00 0.25% |
11.00 0.36% |
28.00 0.35% |
0.00 0.00% |
3.00 0.17% |
13.00 0.22% |
11.00 0.95% |
| Spry | 17.00 0.16% |
10.00 0.15% |
4.00 0.13% |
13.00 0.16% |
1.00 0.17% |
2.00 0.11% |
10.00 0.17% |
2.00 0.17% |


GVU's WWW Surveying Team
Graphics, Visualization, & Usability Center
College of Computing
Georgia Institute of Technology
Atlanta, GA 30332-0280