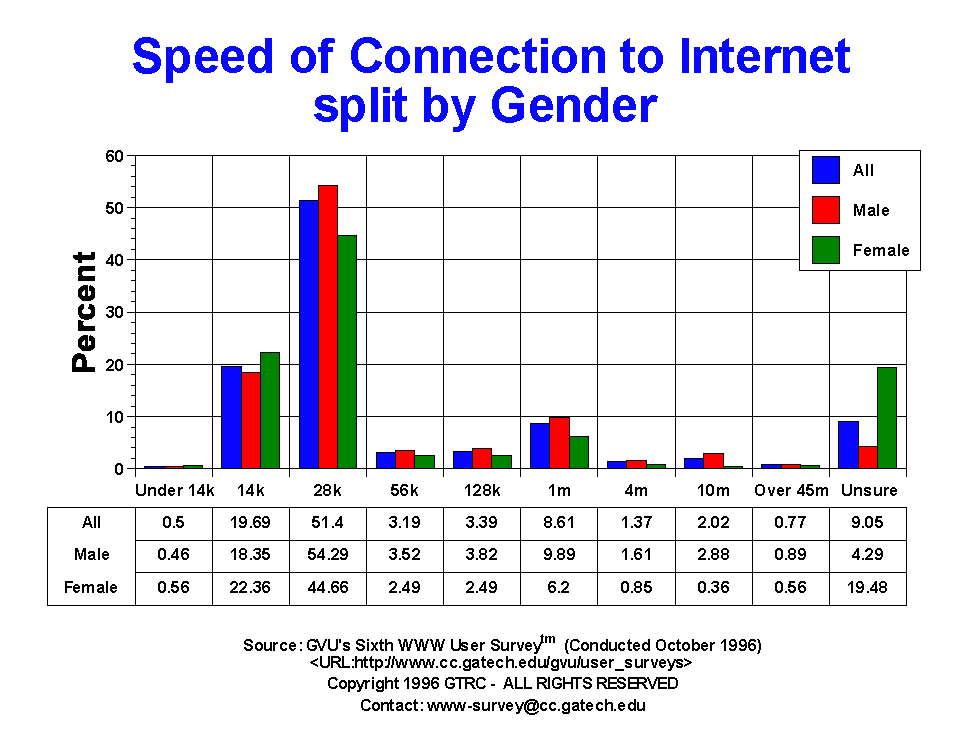

| Connection Speed | All | Male | Female | USA | Europe | 19-25 | 26-50 | 50+ |
| 10m | 209.00 2.02% |
193.00 2.88% |
11.00 0.36% |
150.00 1.86% |
31.00 5.23% |
55.00 3.16% |
127.00 2.12% |
6.00 0.52% |
| 128k | 350.00 3.39% |
256.00 3.82% |
76.00 2.49% |
232.00 2.87% |
51.00 8.60% |
66.00 3.79% |
236.00 3.94% |
17.00 1.48% |
| 14k | 2034.00 19.69% |
1231.00 18.35% |
682.00 22.36% |
1579.00 19.53% |
76.00 12.82% |
309.00 17.73% |
1157.00 19.33% |
268.00 23.26% |
| 1m | 889.00 8.61% |
663.00 9.89% |
189.00 6.20% |
748.00 9.25% |
45.00 7.59% |
221.00 12.68% |
556.00 9.29% |
38.00 3.30% |
| 28k | 5310.00 51.40% |
3641.00 54.29% |
1362.00 44.66% |
4291.00 53.07% |
186.00 31.37% |
685.00 39.30% |
3192.00 53.33% |
722.00 62.67% |
| 4m | 142.00 1.37% |
108.00 1.61% |
26.00 0.85% |
120.00 1.48% |
7.00 1.18% |
34.00 1.95% |
83.00 1.39% |
8.00 0.69% |
| 56k | 330.00 3.19% |
236.00 3.52% |
76.00 2.49% |
240.00 2.97% |
50.00 8.43% |
62.00 3.56% |
202.00 3.38% |
30.00 2.60% |
| Over 45m | 80.00 0.77% |
60.00 0.89% |
17.00 0.56% |
50.00 0.62% |
19.00 3.20% |
18.00 1.03% |
48.00 0.80% |
4.00 0.35% |
| Under 14k | 52.00 0.50% |
31.00 0.46% |
17.00 0.56% |
32.00 0.40% |
5.00 0.84% |
10.00 0.57% |
28.00 0.47% |
5.00 0.43% |
| Unsure | 935.00 9.05% |
288.00 4.29% |
594.00 19.48% |
644.00 7.96% |
123.00 20.74% |
283.00 16.24% |
356.00 5.95% |
54.00 4.69% |


GVU's WWW Surveying Team
Graphics, Visualization, & Usability Center
College of Computing
Georgia Institute of Technology
Atlanta, GA 30332-0280