
| Electronic News | All | Male | Female | USA | Europe | 19-25 | 26-50 | 50+ |
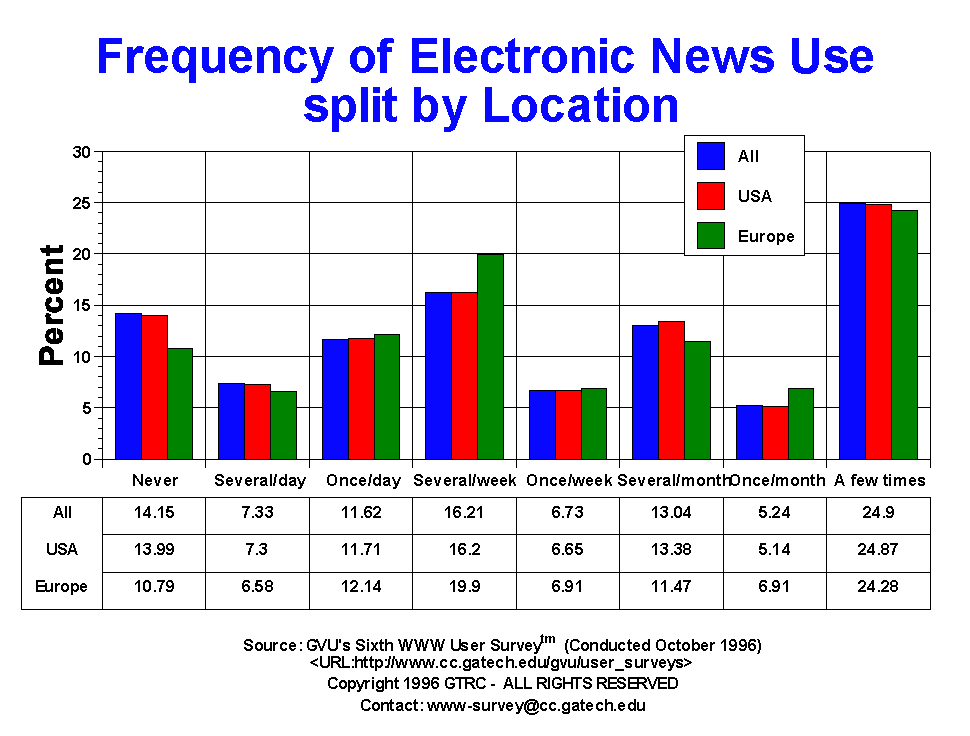
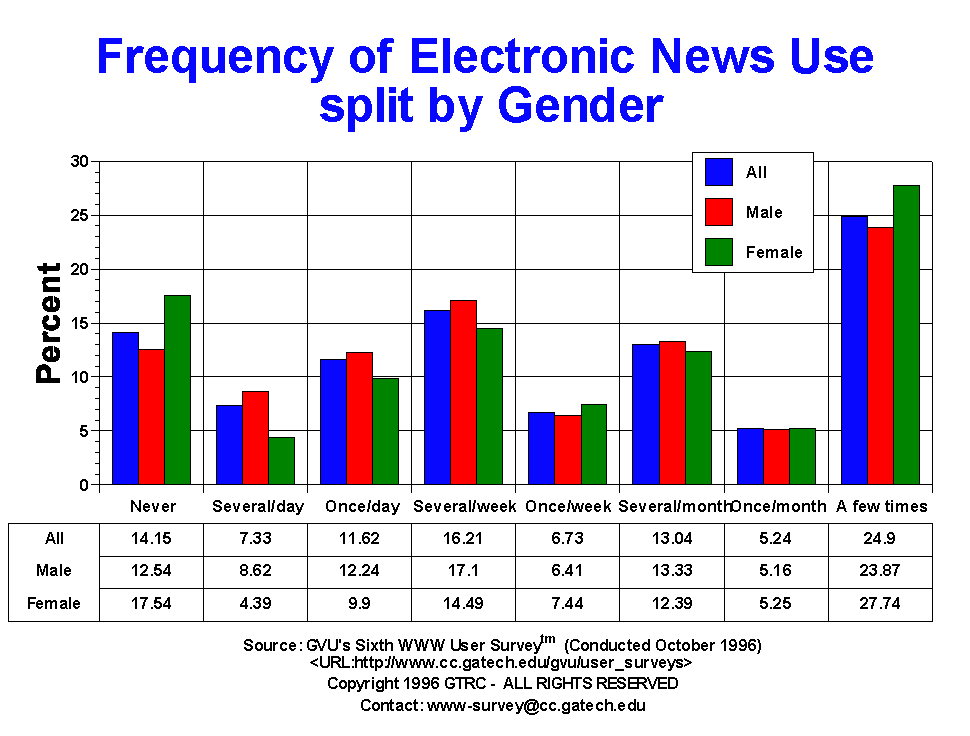
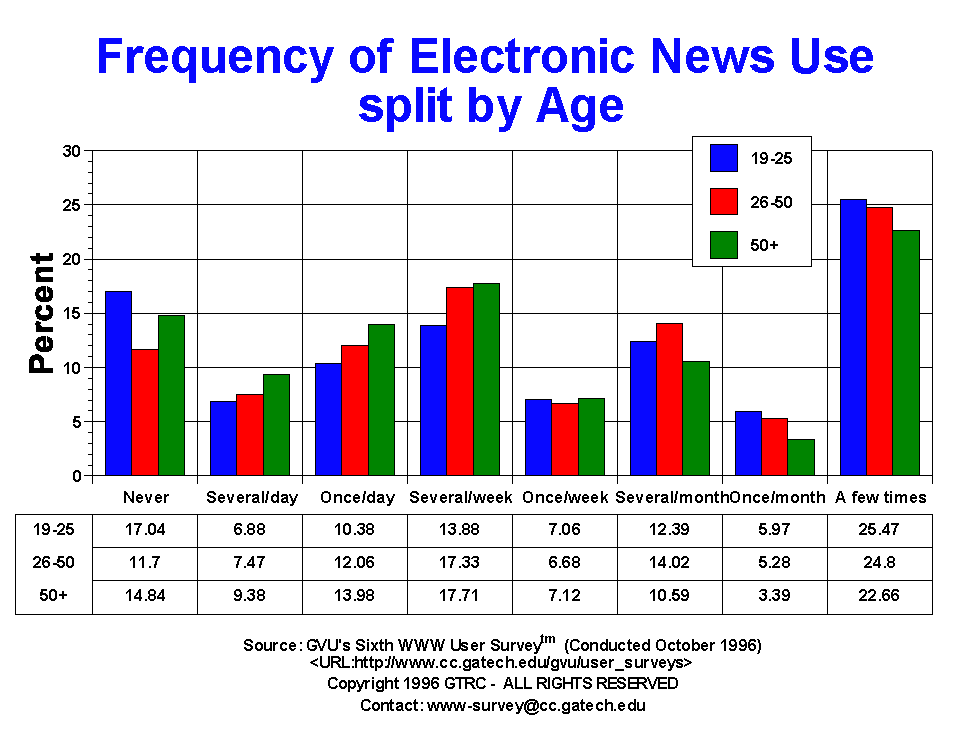
| A few times | 2572.00 24.90% |
1601.00 23.87% |
846.00 27.74% |
2011.00 24.87% |
144.00 24.28% |
444.00 25.47% |
1484.00 24.80% |
261.00 22.66% |
| Don't know | 82.00 0.79% |
49.00 0.73% |
26.00 0.85% |
61.00 0.75% |
6.00 1.01% |
16.00 0.92% |
40.00 0.67% |
4.00 0.35% |
| Never | 1462.00 14.15% |
841.00 12.54% |
535.00 17.54% |
1131.00 13.99% |
64.00 10.79% |
297.00 17.04% |
700.00 11.70% |
171.00 14.84% |
| Once per day | 1200.00 11.62% |
821.00 12.24% |
302.00 9.90% |
947.00 11.71% |
72.00 12.14% |
181.00 10.38% |
722.00 12.06% |
161.00 13.98% |
| Once per month | 541.00 5.24% |
346.00 5.16% |
160.00 5.25% |
416.00 5.14% |
41.00 6.91% |
104.00 5.97% |
316.00 5.28% |
39.00 3.39% |
| Once per week | 695.00 6.73% |
430.00 6.41% |
227.00 7.44% |
538.00 6.65% |
41.00 6.91% |
123.00 7.06% |
400.00 6.68% |
82.00 7.12% |
| Several times per day | 757.00 7.33% |
578.00 8.62% |
134.00 4.39% |
590.00 7.30% |
39.00 6.58% |
120.00 6.88% |
447.00 7.47% |
108.00 9.38% |
| Several times per month | 1347.00 13.04% |
894.00 13.33% |
378.00 12.39% |
1082.00 13.38% |
68.00 11.47% |
216.00 12.39% |
839.00 14.02% |
122.00 10.59% |
| Several times per week | 1675.00 16.21% |
1147.00 17.10% |
442.00 14.49% |
1310.00 16.20% |
118.00 19.90% |
242.00 13.88% |
1037.00 17.33% |
204.00 17.71% |


GVU's WWW Surveying Team
Graphics, Visualization, & Usability Center
College of Computing
Georgia Institute of Technology
Atlanta, GA 30332-0280