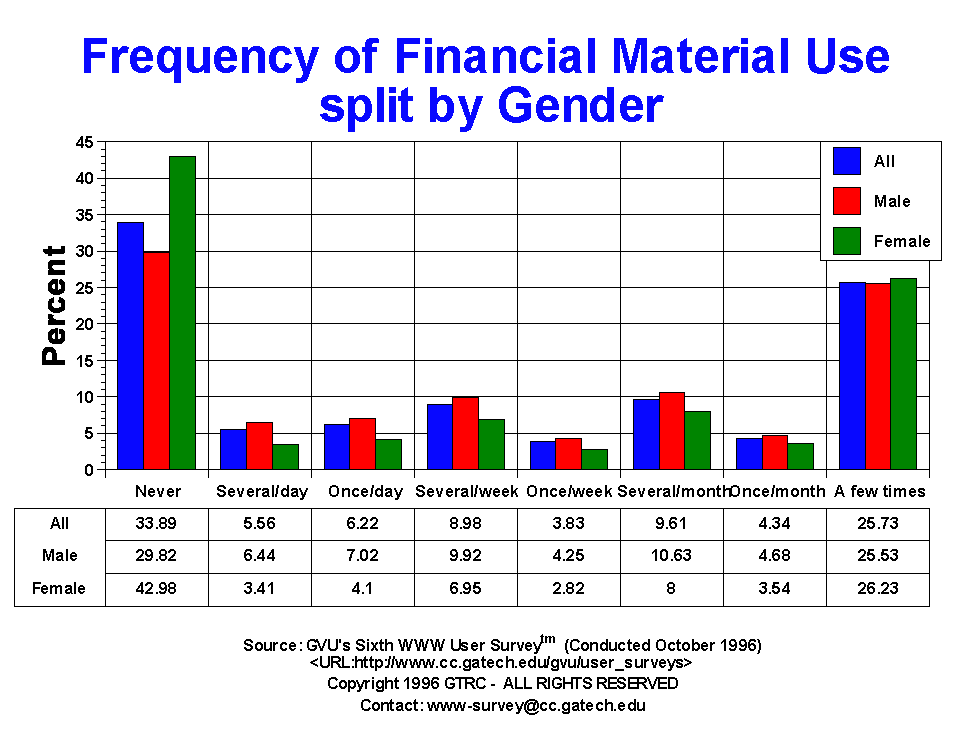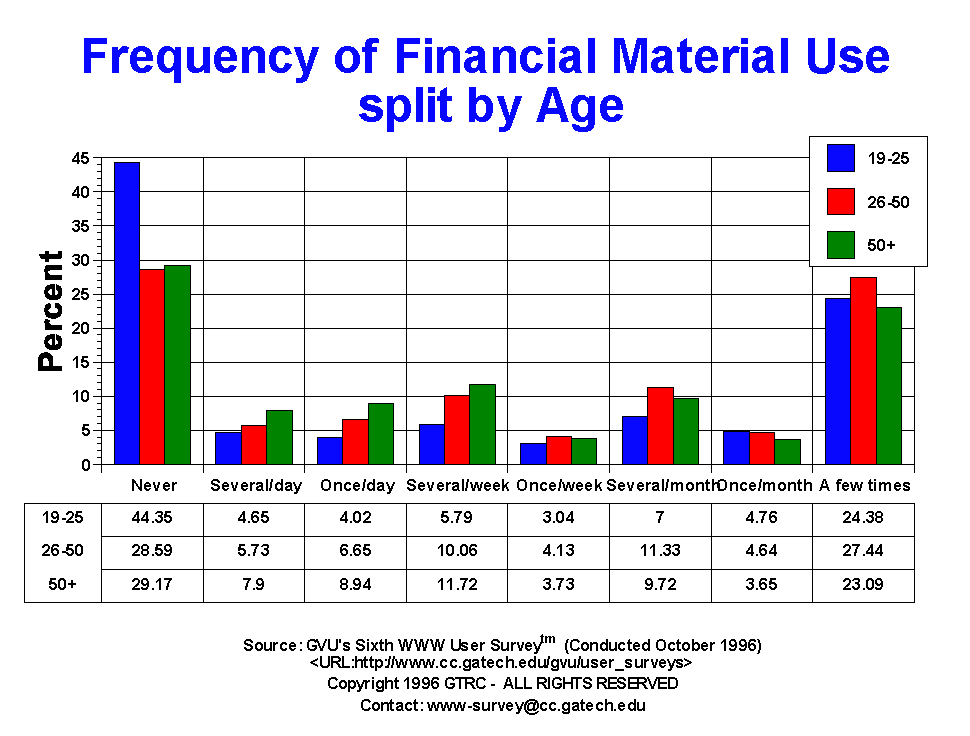

| Financial Material | All | Male | Female | USA | Europe | 19-25 | 26-50 | 50+ |
| A few times | 2658.00 25.73% |
1712.00 25.53% |
800.00 26.23% |
2074.00 25.65% |
157.00 26.48% |
425.00 24.38% |
1642.00 27.44% |
266.00 23.09% |
| Don't know | 189.00 1.83% |
114.00 1.70% |
60.00 1.97% |
139.00 1.72% |
13.00 2.19% |
35.00 2.01% |
86.00 1.44% |
23.00 2.00% |
| Never | 3501.00 33.89% |
2000.00 29.82% |
1311.00 42.98% |
2576.00 31.86% |
268.00 45.19% |
773.00 44.35% |
1711.00 28.59% |
336.00 29.17% |
| Not Answer | 1.00 0.01% |
1.00 0.01% |
0.00 0.00% |
1.00 0.01% |
0.00 0.00% |
0.00 0.00% |
0.00 0.00% |
1.00 0.09% |
| Once per day | 643.00 6.22% |
471.00 7.02% |
125.00 4.10% |
542.00 6.70% |
17.00 2.87% |
70.00 4.02% |
398.00 6.65% |
103.00 8.94% |
| Once per month | 448.00 4.34% |
314.00 4.68% |
108.00 3.54% |
351.00 4.34% |
22.00 3.71% |
83.00 4.76% |
278.00 4.64% |
42.00 3.65% |
| Once per week | 396.00 3.83% |
285.00 4.25% |
86.00 2.82% |
320.00 3.96% |
21.00 3.54% |
53.00 3.04% |
247.00 4.13% |
43.00 3.73% |
| Several times per day | 574.00 5.56% |
432.00 6.44% |
104.00 3.41% |
489.00 6.05% |
15.00 2.53% |
81.00 4.65% |
343.00 5.73% |
91.00 7.90% |
| Several times per month | 993.00 9.61% |
713.00 10.63% |
244.00 8.00% |
834.00 10.31% |
40.00 6.75% |
122.00 7.00% |
678.00 11.33% |
112.00 9.72% |
| Several times per week | 928.00 8.98% |
665.00 9.92% |
212.00 6.95% |
760.00 9.40% |
40.00 6.75% |
101.00 5.79% |
602.00 10.06% |
135.00 11.72% |


GVU's WWW Surveying Team
Graphics, Visualization, & Usability Center
College of Computing
Georgia Institute of Technology
Atlanta, GA 30332-0280