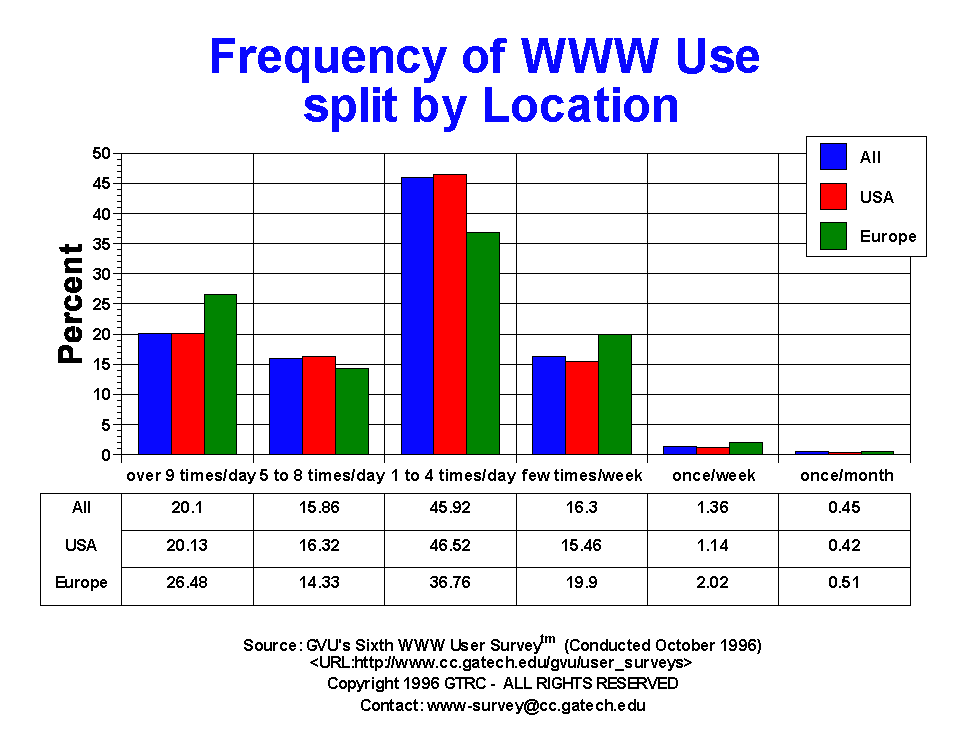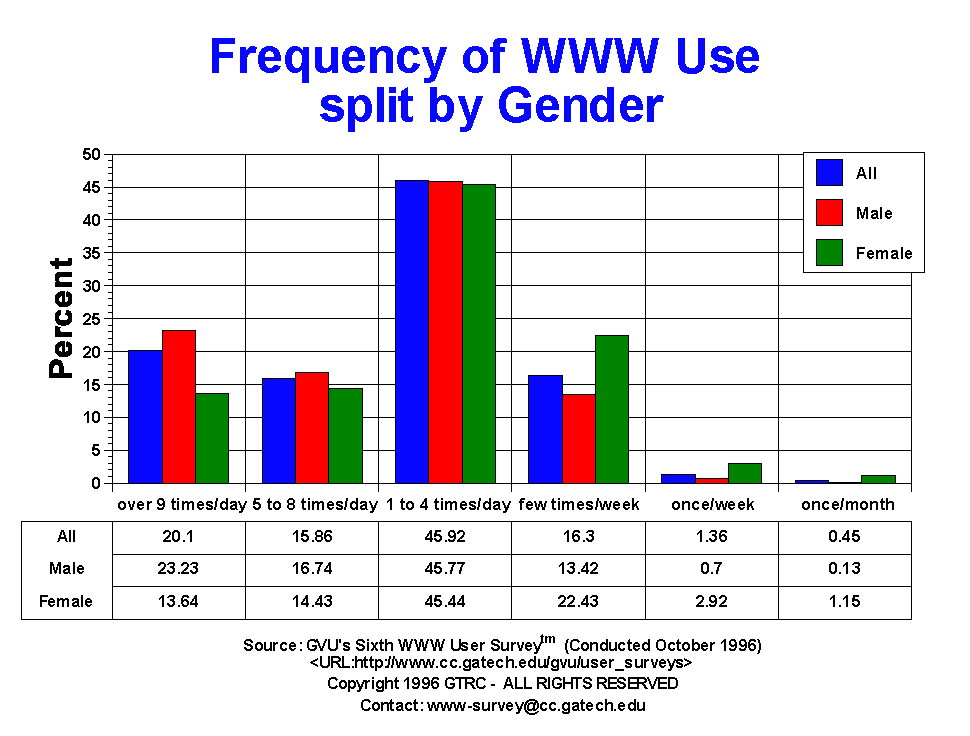

| Frequency of Use | All | Male | Female | USA | Europe | 19-25 | 26-50 | 50+ |
| 1-4/dy | 4744.00 45.92% |
3070.00 45.77% |
1386.00 45.44% |
3762.00 46.52% |
218.00 36.76% |
697.00 39.99% |
2753.00 46.00% |
603.00 52.34% |
| 5-8/dy | 1638.00 15.86% |
1123.00 16.74% |
440.00 14.43% |
1320.00 16.32% |
85.00 14.33% |
300.00 17.21% |
965.00 16.12% |
167.00 14.50% |
| Few Times/wk | 1684.00 16.30% |
900.00 13.42% |
684.00 22.43% |
1250.00 15.46% |
118.00 19.90% |
263.00 15.09% |
905.00 15.12% |
242.00 21.01% |
| Once/mo | 47.00 0.45% |
9.00 0.13% |
35.00 1.15% |
34.00 0.42% |
3.00 0.51% |
13.00 0.75% |
16.00 0.27% |
5.00 0.43% |
| Once/wk | 141.00 1.36% |
47.00 0.70% |
89.00 2.92% |
92.00 1.14% |
12.00 2.02% |
42.00 2.41% |
59.00 0.99% |
12.00 1.04% |
| Over 9/dy | 2077.00 20.10% |
1558.00 23.23% |
416.00 13.64% |
1628.00 20.13% |
157.00 26.48% |
428.00 24.56% |
1287.00 21.50% |
123.00 10.68% |


GVU's WWW Surveying Team
Graphics, Visualization, & Usability Center
College of Computing
Georgia Institute of Technology
Atlanta, GA 30332-0280