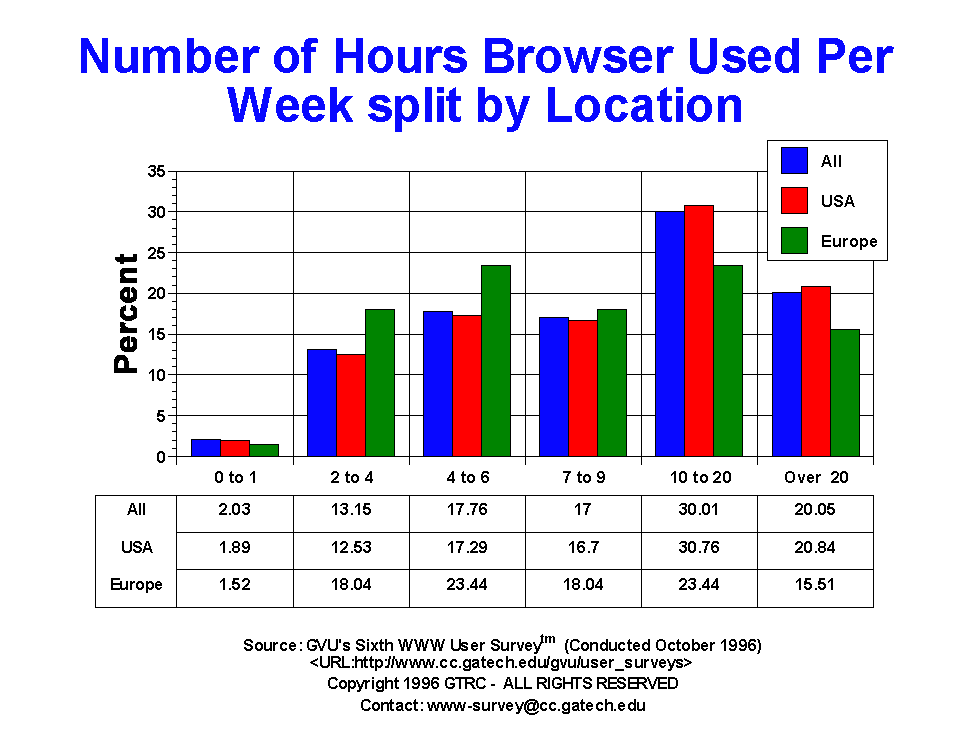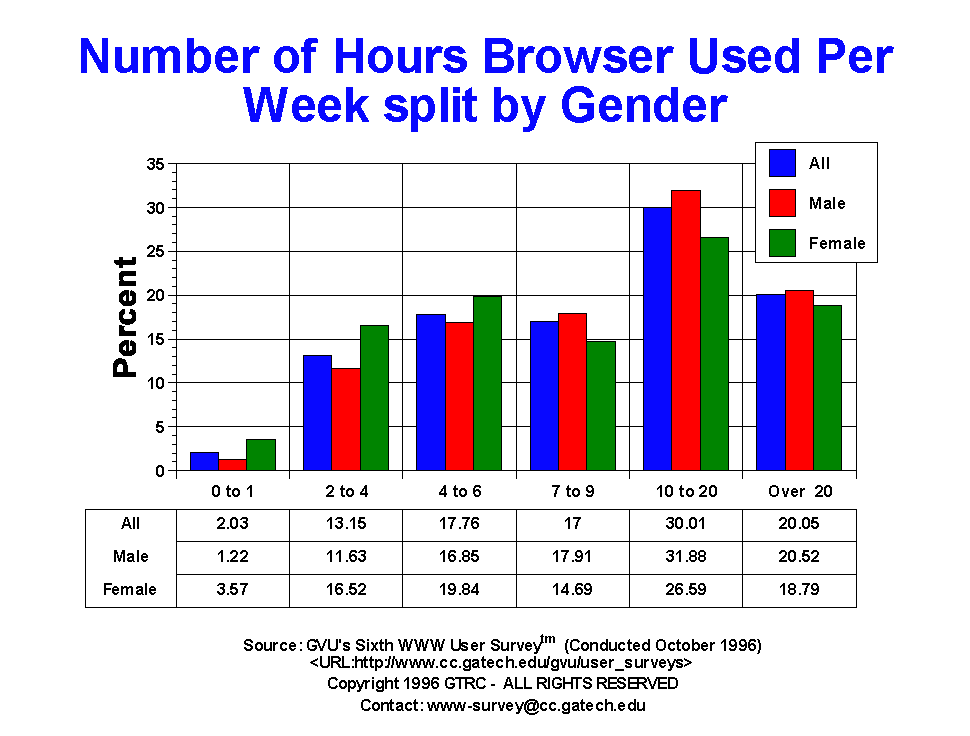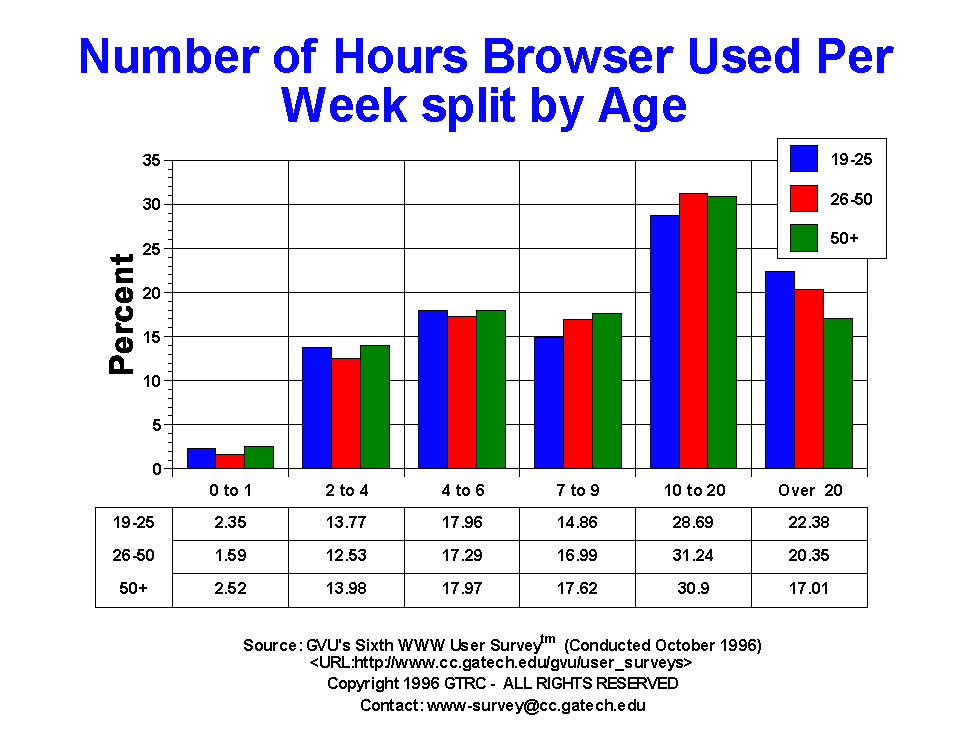

| Hours Used | All | Male | Female | USA | Europe | 19-25 | 26-50 | 50+ |
| 0-1 | 210.00 2.03% |
82.00 1.22% |
109.00 3.57% |
153.00 1.89% |
9.00 1.52% |
41.00 2.35% |
95.00 1.59% |
29.00 2.52% |
| 10-20 | 3100.00 30.01% |
2138.00 31.88% |
811.00 26.59% |
2487.00 30.76% |
139.00 23.44% |
500.00 28.69% |
1870.00 31.24% |
356.00 30.90% |
| 2-4 | 1359.00 13.15% |
780.00 11.63% |
504.00 16.52% |
1013.00 12.53% |
107.00 18.04% |
240.00 13.77% |
750.00 12.53% |
161.00 13.98% |
| 4-6 | 1835.00 17.76% |
1130.00 16.85% |
605.00 19.84% |
1398.00 17.29% |
139.00 23.44% |
313.00 17.96% |
1035.00 17.29% |
207.00 17.97% |
| 7-9 | 1756.00 17.00% |
1201.00 17.91% |
448.00 14.69% |
1350.00 16.70% |
107.00 18.04% |
259.00 14.86% |
1017.00 16.99% |
203.00 17.62% |
| Over 20 | 2071.00 20.05% |
1376.00 20.52% |
573.00 18.79% |
1685.00 20.84% |
92.00 15.51% |
390.00 22.38% |
1218.00 20.35% |
196.00 17.01% |


GVU's WWW Surveying Team
Graphics, Visualization, & Usability Center
College of Computing
Georgia Institute of Technology
Atlanta, GA 30332-0280