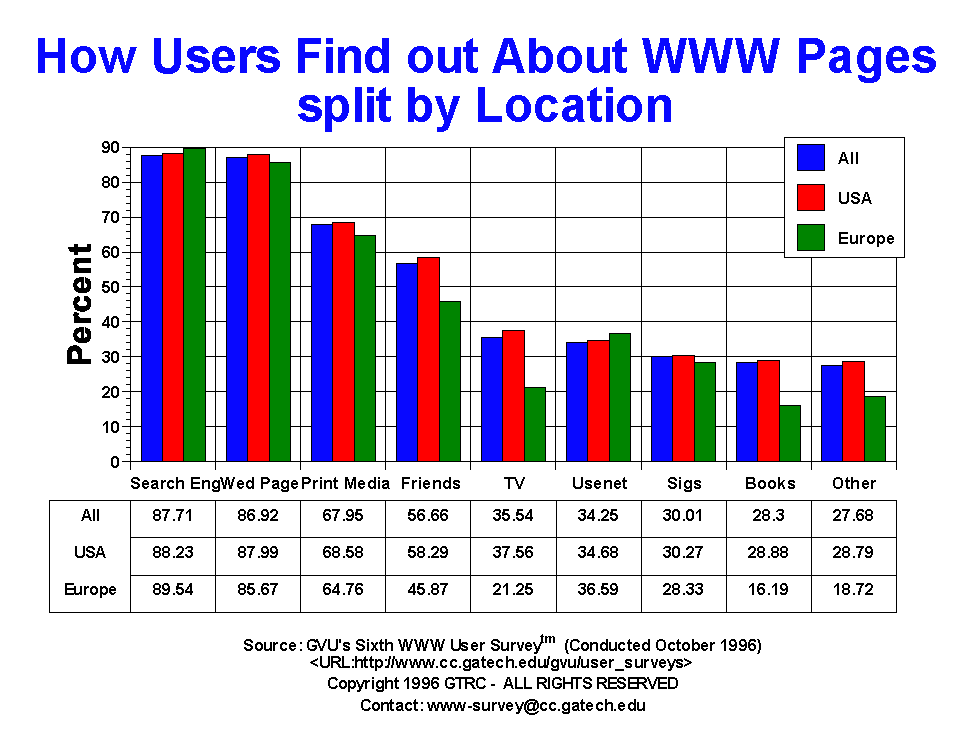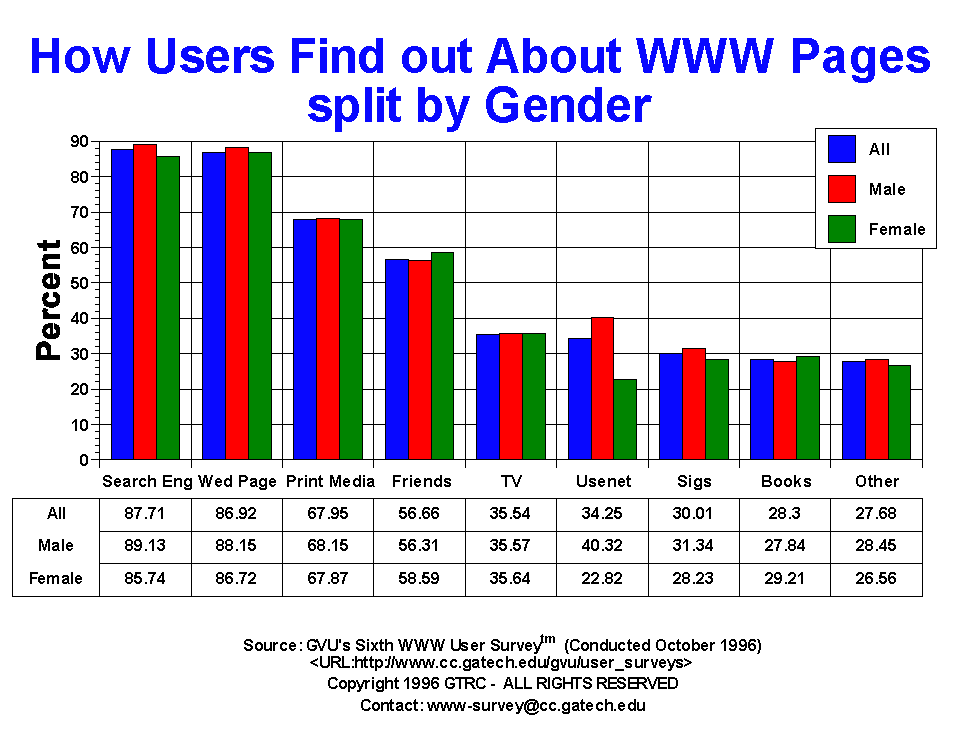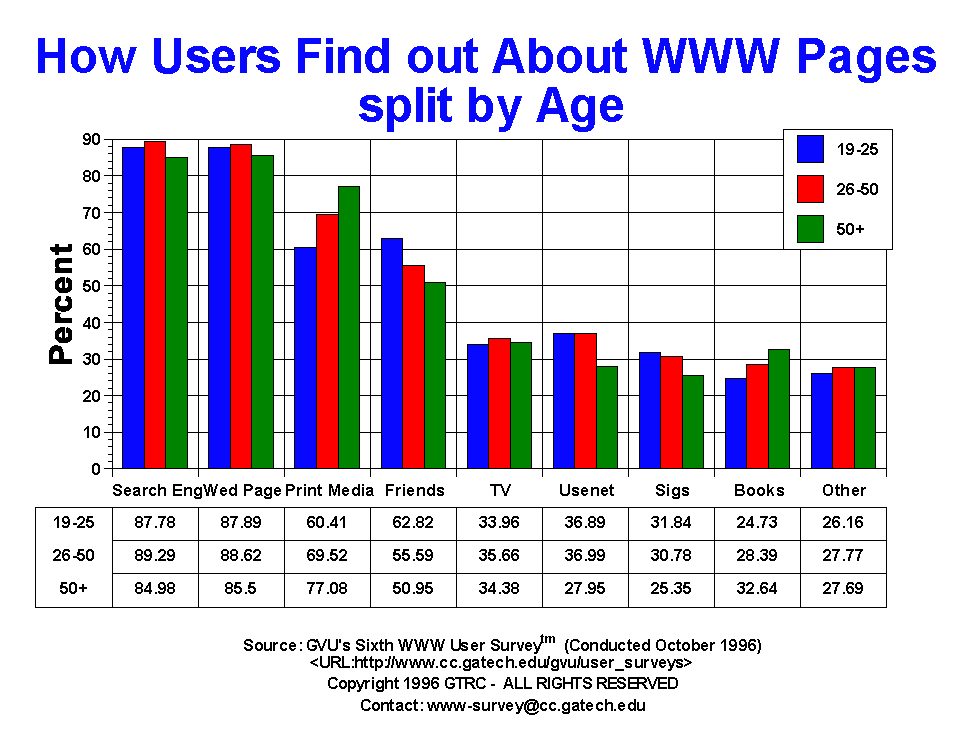

| How Users Find out About WWW Pages | All | Male | Female | USA | Europe | 19-25 | 26-50 | 50+ |
| Books | 2924.00 28.30% |
1867.00 27.84% |
891.00 29.21% |
2335.00 28.88% |
96.00 16.19% |
431.00 24.73% |
1699.00 28.39% |
376.00 32.64% |
| Friends | 5854.00 56.66% |
3777.00 56.31% |
1787.00 58.59% |
4713.00 58.29% |
272.00 45.87% |
1095.00 62.82% |
3327.00 55.59% |
587.00 50.95% |
| Other | 2860.00 27.68% |
1908.00 28.45% |
810.00 26.56% |
2328.00 28.79% |
111.00 18.72% |
456.00 26.16% |
1662.00 27.77% |
319.00 27.69% |
| Printed Media | 7020.00 67.95% |
4571.00 68.15% |
2070.00 67.87% |
5545.00 68.58% |
384.00 64.76% |
1053.00 60.41% |
4161.00 69.52% |
888.00 77.08% |
| Search Engines | 9061.00 87.71% |
5978.00 89.13% |
2615.00 85.74% |
7134.00 88.23% |
531.00 89.54% |
1530.00 87.78% |
5344.00 89.29% |
979.00 84.98% |
| Sigs | 3100.00 30.01% |
2102.00 31.34% |
861.00 28.23% |
2448.00 30.27% |
168.00 28.33% |
555.00 31.84% |
1842.00 30.78% |
292.00 25.35% |
| TV | 3672.00 35.54% |
2386.00 35.57% |
1087.00 35.64% |
3037.00 37.56% |
126.00 21.25% |
592.00 33.96% |
2134.00 35.66% |
396.00 34.38% |
| Usenet | 3538.00 34.25% |
2704.00 40.32% |
696.00 22.82% |
2804.00 34.68% |
217.00 36.59% |
643.00 36.89% |
2214.00 36.99% |
322.00 27.95% |
| WWW Pages | 8980.00 86.92% |
5912.00 88.15% |
2645.00 86.72% |
7115.00 87.99% |
508.00 85.67% |
1532.00 87.89% |
5304.00 88.62% |
985.00 85.50% |


GVU's WWW Surveying Team
Graphics, Visualization, & Usability Center
College of Computing
Georgia Institute of Technology
Atlanta, GA 30332-0280