
| Image Loading | All | Male | Female | USA | Europe | 19-25 | 26-50 | 50+ |
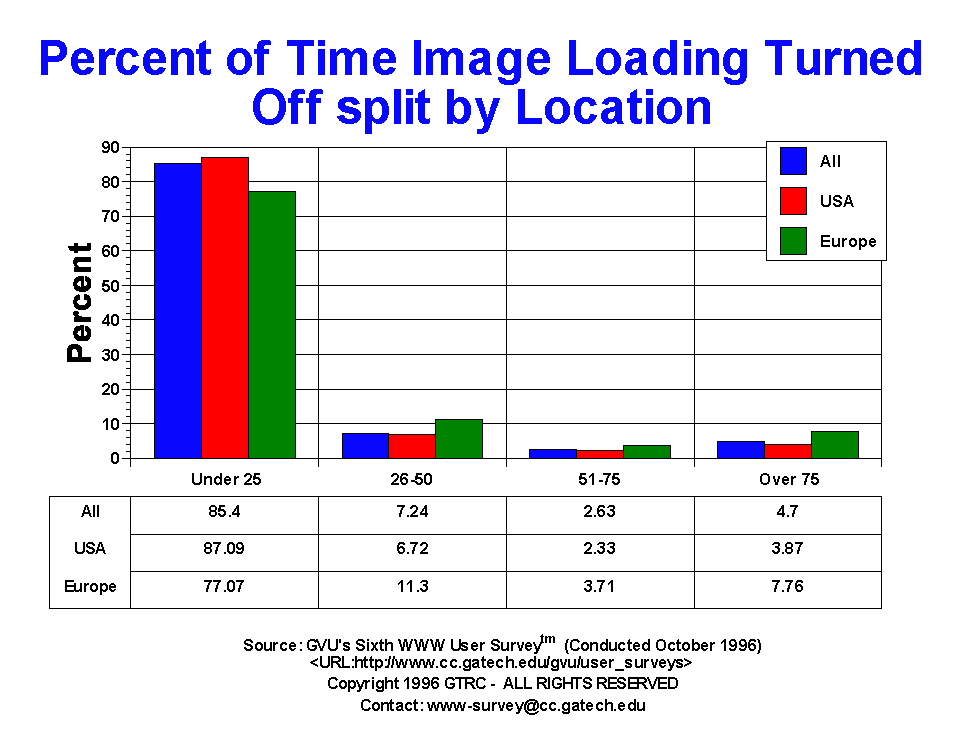
| 26-50 | 748.00 7.24% |
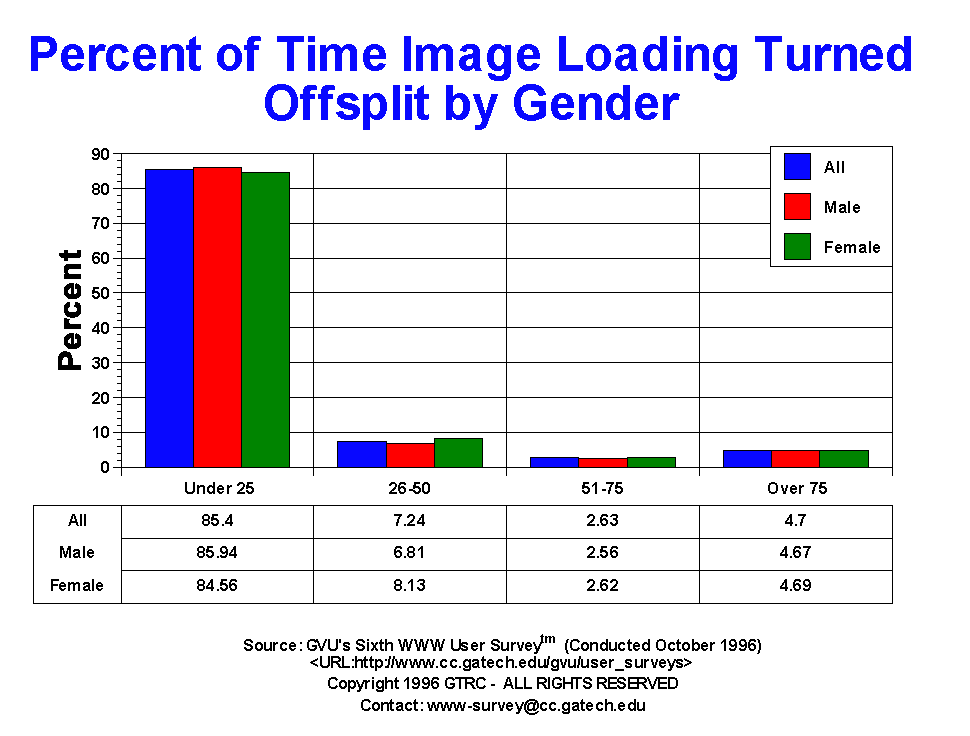
457.00 6.81% |
248.00 8.13% |
543.00 6.72% |
67.00 11.30% |
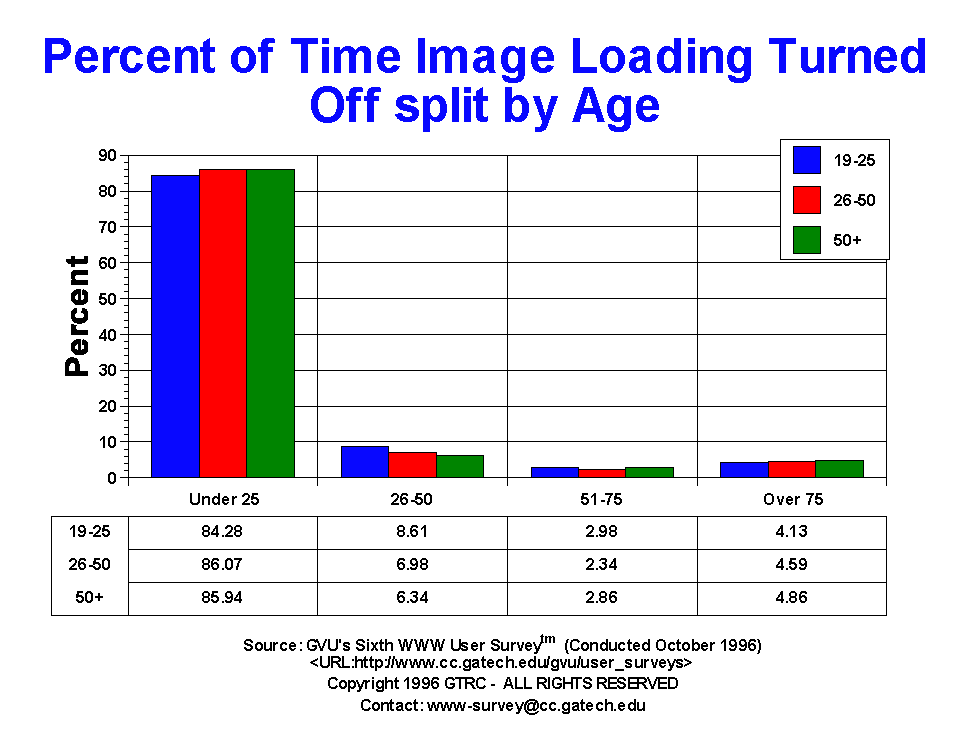
150.00 8.61% |
418.00 6.98% |
73.00 6.34% |
| 51-75 | 272.00 2.63% |
172.00 2.56% |
80.00 2.62% |
188.00 2.33% |
22.00 3.71% |
52.00 2.98% |
140.00 2.34% |
33.00 2.86% |
| Once per month | 1.00 0.01% |
0.00 0.00% |
0.00 0.00% |
0.00 0.00% |
0.00 0.00% |
0.00 0.00% |
0.00 0.00% |
0.00 0.00% |
| Over 75 | 486.00 4.70% |
313.00 4.67% |
143.00 4.69% |
313.00 3.87% |
46.00 7.76% |
72.00 4.13% |
275.00 4.59% |
56.00 4.86% |
| Under 25 | 8823.00 85.40% |
5764.00 85.94% |
2579.00 84.56% |
7042.00 87.09% |
457.00 77.07% |
1469.00 84.28% |
5151.00 86.07% |
990.00 85.94% |
GVU's WWW Surveying Team
Graphics, Visualization, & Usability Center
College of Computing
Georgia Institute of Technology
Atlanta, GA 30332-0280