
| Monitor Color Support | All | Male | Female | USA | Europe | 19-25 | 26-50 | 50+ |
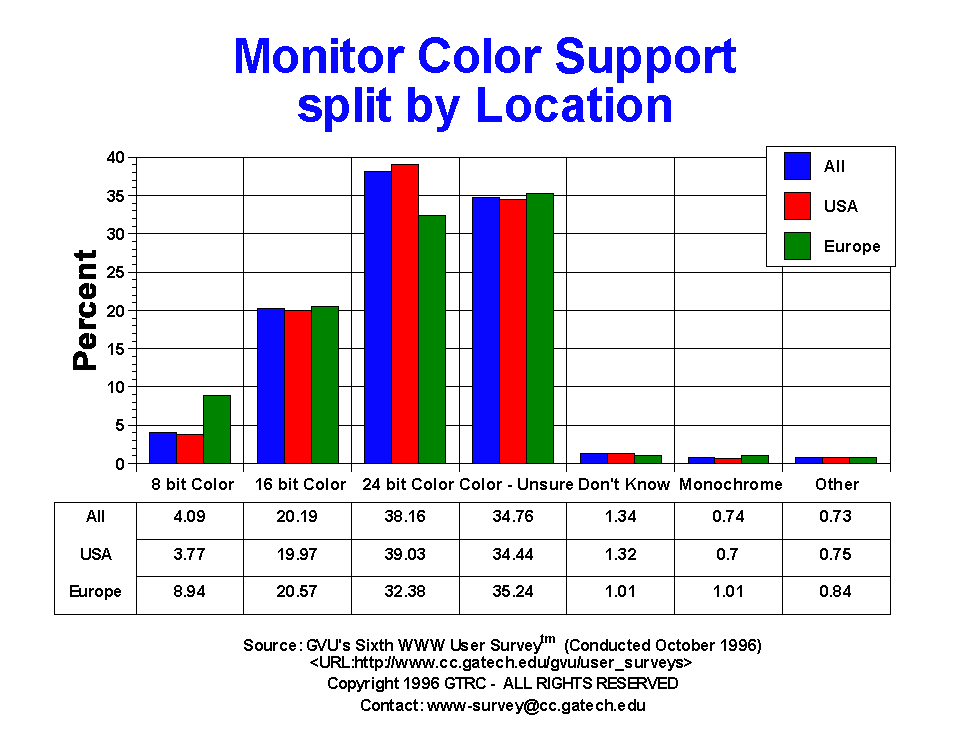
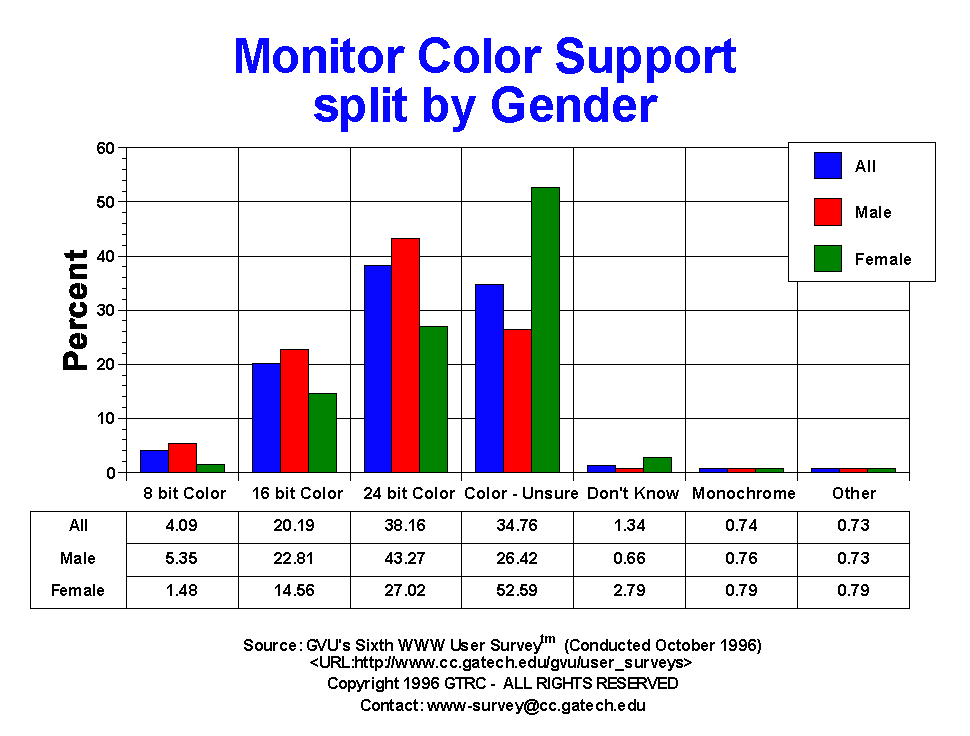
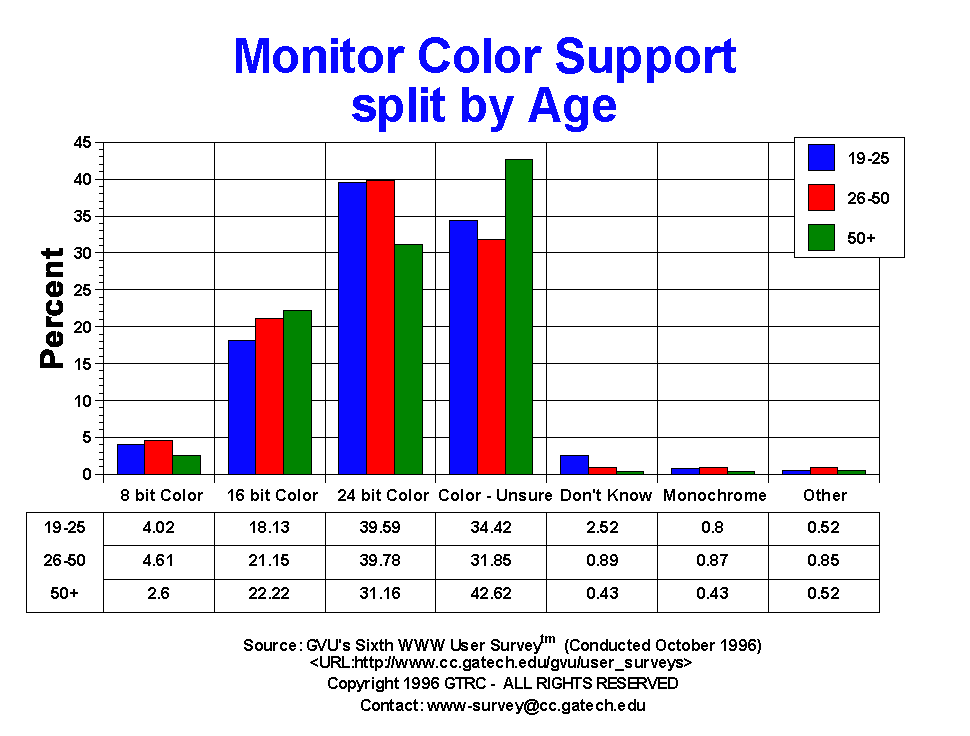
| 16 bit Color | 2086.00 20.19% |
1530.00 22.81% |
444.00 14.56% |
1615.00 19.97% |
122.00 20.57% |
316.00 18.13% |
1266.00 21.15% |
256.00 22.22% |
| 24 bit Color | 3942.00 38.16% |
2902.00 43.27% |
824.00 27.02% |
3156.00 39.03% |
192.00 32.38% |
690.00 39.59% |
2381.00 39.78% |
359.00 31.16% |
| 8 bit Color | 423.00 4.09% |
359.00 5.35% |
45.00 1.48% |
305.00 3.77% |
53.00 8.94% |
70.00 4.02% |
276.00 4.61% |
30.00 2.60% |
| Color | 3591.00 34.76% |
1772.00 26.42% |
1604.00 52.59% |
2785.00 34.44% |
209.00 35.24% |
600.00 34.42% |
1906.00 31.85% |
491.00 42.62% |
| Don't Know | 138.00 1.34% |
44.00 0.66% |
85.00 2.79% |
107.00 1.32% |
6.00 1.01% |
44.00 2.52% |
53.00 0.89% |
5.00 0.43% |
| Monochrome | 76.00 0.74% |
51.00 0.76% |
24.00 0.79% |
57.00 0.70% |
6.00 1.01% |
14.00 0.80% |
52.00 0.87% |
5.00 0.43% |
| Other | 75.00 0.73% |
49.00 0.73% |
24.00 0.79% |
61.00 0.75% |
5.00 0.84% |
9.00 0.52% |
51.00 0.85% |
6.00 0.52% |


GVU's WWW Surveying Team
Graphics, Visualization, & Usability Center
College of Computing
Georgia Institute of Technology
Atlanta, GA 30332-0280