
| Monitor Resolution | All | Male | Female | USA | Europe | 19-25 | 26-50 | 50+ |
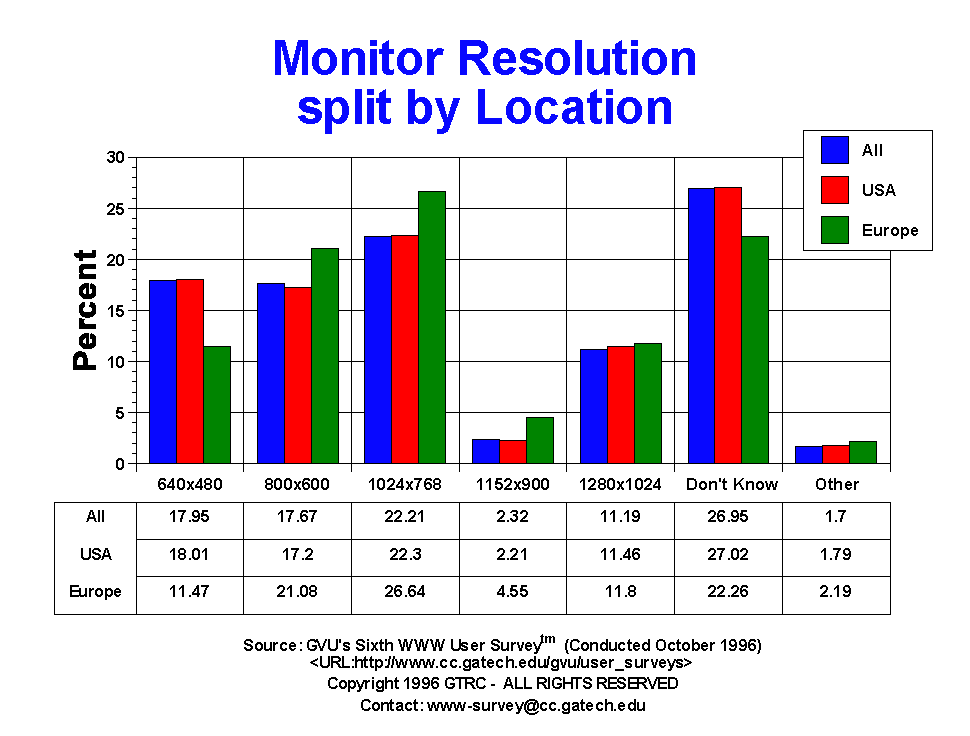
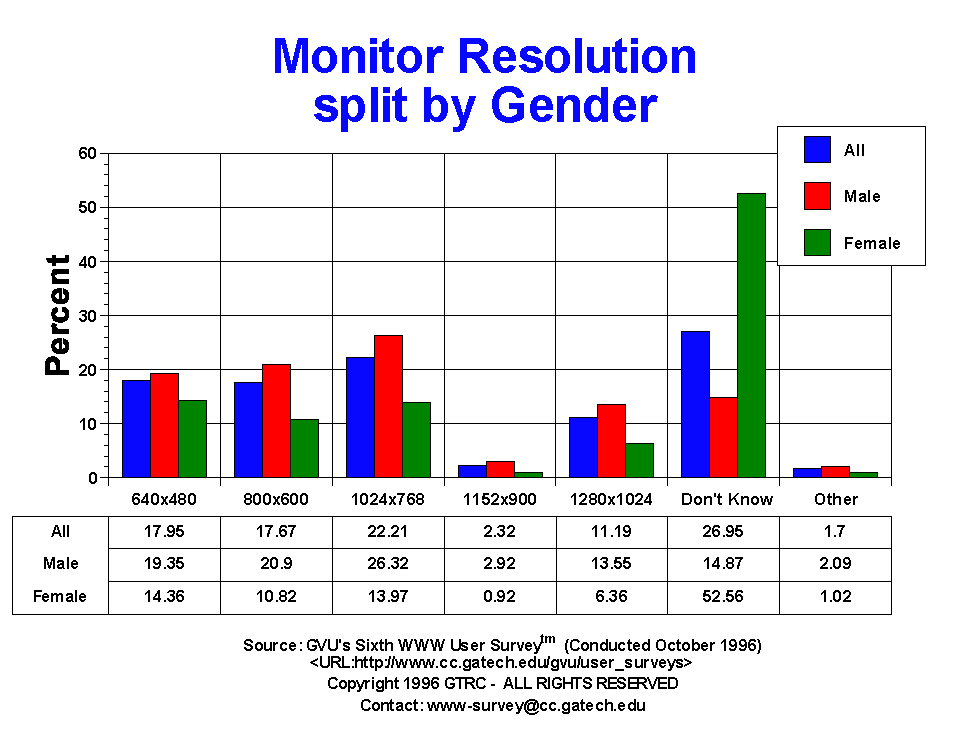
| 1024x768 | 2295.00 22.21% |
1765.00 26.32% |
426.00 13.97% |
1803.00 22.30% |
158.00 26.64% |
373.00 21.40% |
1438.00 24.03% |
235.00 20.40% |
| 1152x900 | 240.00 2.32% |
196.00 2.92% |
28.00 0.92% |
179.00 2.21% |
27.00 4.55% |
39.00 2.24% |
163.00 2.72% |
9.00 0.78% |
| 1280x1024 | 1156.00 11.19% |
909.00 13.55% |
194.00 6.36% |
927.00 11.46% |
70.00 11.80% |
209.00 11.99% |
718.00 12.00% |
101.00 8.77% |
| 640x480 | 1854.00 17.95% |
1298.00 19.35% |
438.00 14.36% |
1456.00 18.01% |
68.00 11.47% |
230.00 13.20% |
1105.00 18.46% |
259.00 22.48% |
| 800x600 | 1825.00 17.67% |
1402.00 20.90% |
330.00 10.82% |
1391.00 17.20% |
125.00 21.08% |
327.00 18.76% |
1079.00 18.03% |
186.00 16.15% |
| Don't Know | 2784.00 26.95% |
997.00 14.87% |
1603.00 52.56% |
2185.00 27.02% |
132.00 22.26% |
538.00 30.87% |
1370.00 22.89% |
347.00 30.12% |
| Once per day | 1.00 0.01% |
0.00 0.00% |
0.00 0.00% |
0.00 0.00% |
0.00 0.00% |
0.00 0.00% |
0.00 0.00% |
0.00 0.00% |
| Other | 176.00 1.70% |
140.00 2.09% |
31.00 1.02% |
145.00 1.79% |
13.00 2.19% |
27.00 1.55% |
112.00 1.87% |
15.00 1.30% |


GVU's WWW Surveying Team
Graphics, Visualization, & Usability Center
College of Computing
Georgia Institute of Technology
Atlanta, GA 30332-0280