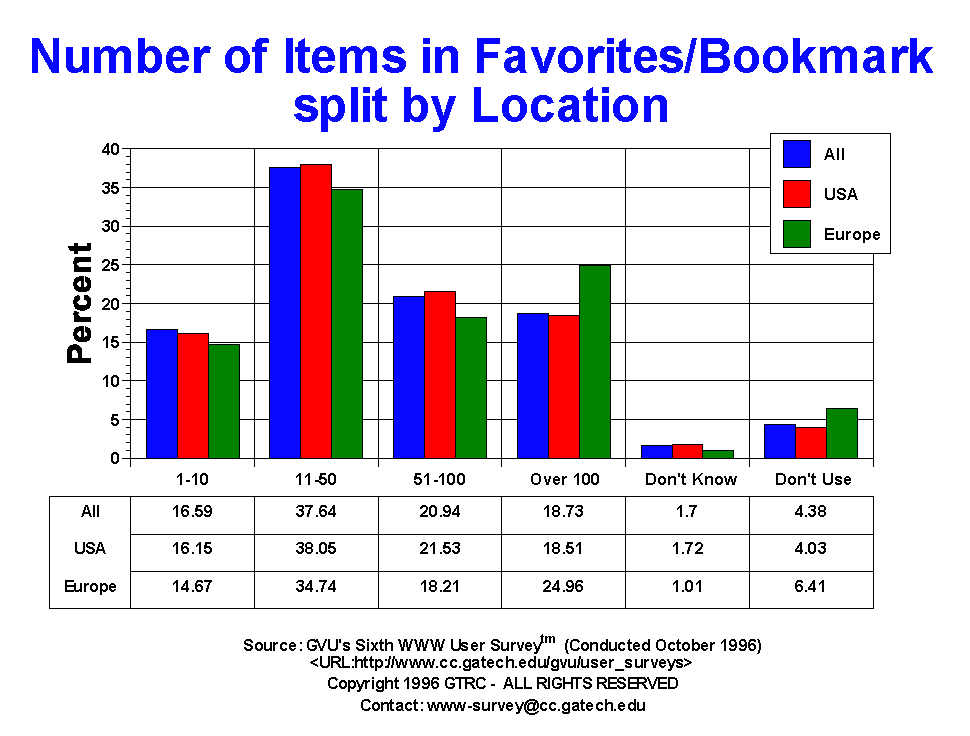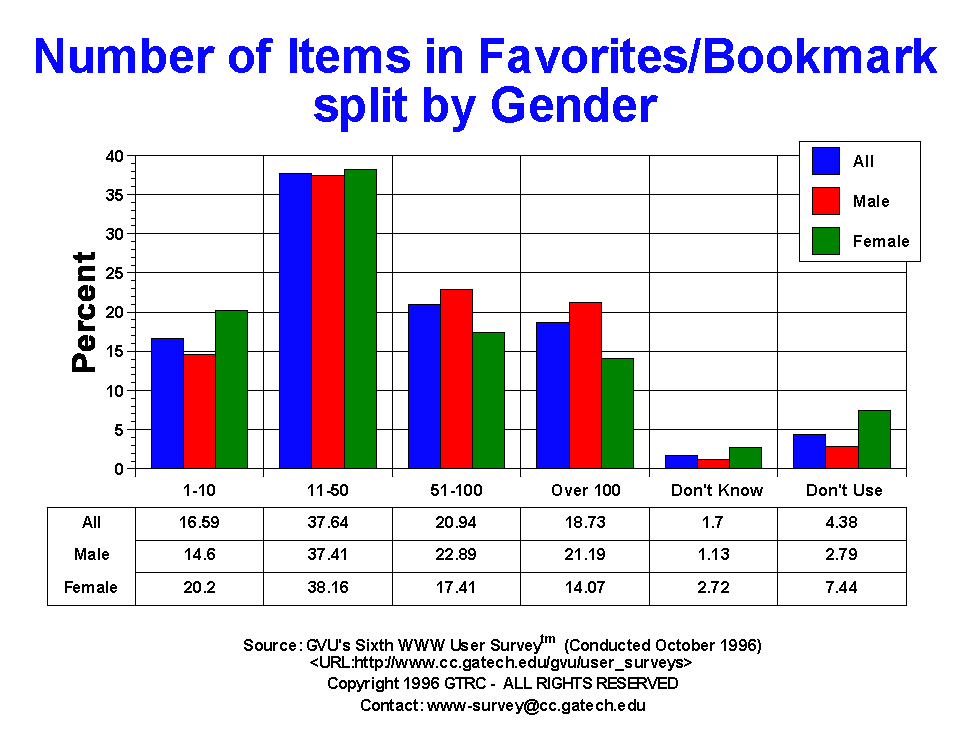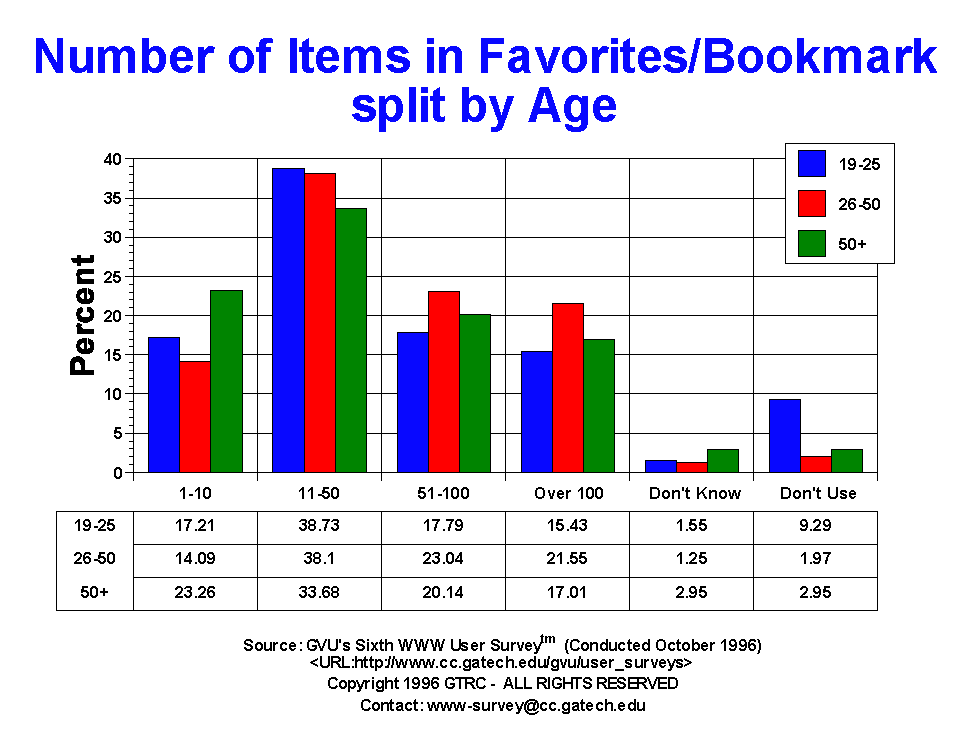

| Number of Items in Favorites Bookmark | All | Male | Female | USA | Europe | 19-25 | 26-50 | 50+ |
| 1-10 | 1714.00 16.59% |
979.00 14.60% |
616.00 20.20% |
1306.00 16.15% |
87.00 14.67% |
300.00 17.21% |
843.00 14.09% |
268.00 23.26% |
| 11-50 | 3889.00 37.64% |
2509.00 37.41% |
1164.00 38.16% |
3077.00 38.05% |
206.00 34.74% |
675.00 38.73% |
2280.00 38.10% |
388.00 33.68% |
| 51-100 | 2163.00 20.94% |
1535.00 22.89% |
531.00 17.41% |
1741.00 21.53% |
108.00 18.21% |
310.00 17.79% |
1379.00 23.04% |
232.00 20.14% |
| Don't Know | 176.00 1.70% |
76.00 1.13% |
83.00 2.72% |
139.00 1.72% |
6.00 1.01% |
27.00 1.55% |
75.00 1.25% |
34.00 2.95% |
| Don't Use | 453.00 4.38% |
187.00 2.79% |
227.00 7.44% |
326.00 4.03% |
38.00 6.41% |
162.00 9.29% |
118.00 1.97% |
34.00 2.95% |
| Over 100 | 1935.00 18.73% |
1421.00 21.19% |
429.00 14.07% |
1497.00 18.51% |
148.00 24.96% |
269.00 15.43% |
1290.00 21.55% |
196.00 17.01% |
| Yes | 1.00 0.01% |
0.00 0.00% |
0.00 0.00% |
0.00 0.00% |
0.00 0.00% |
0.00 0.00% |
0.00 0.00% |
0.00 0.00% |


GVU's WWW Surveying Team
Graphics, Visualization, & Usability Center
College of Computing
Georgia Institute of Technology
Atlanta, GA 30332-0280