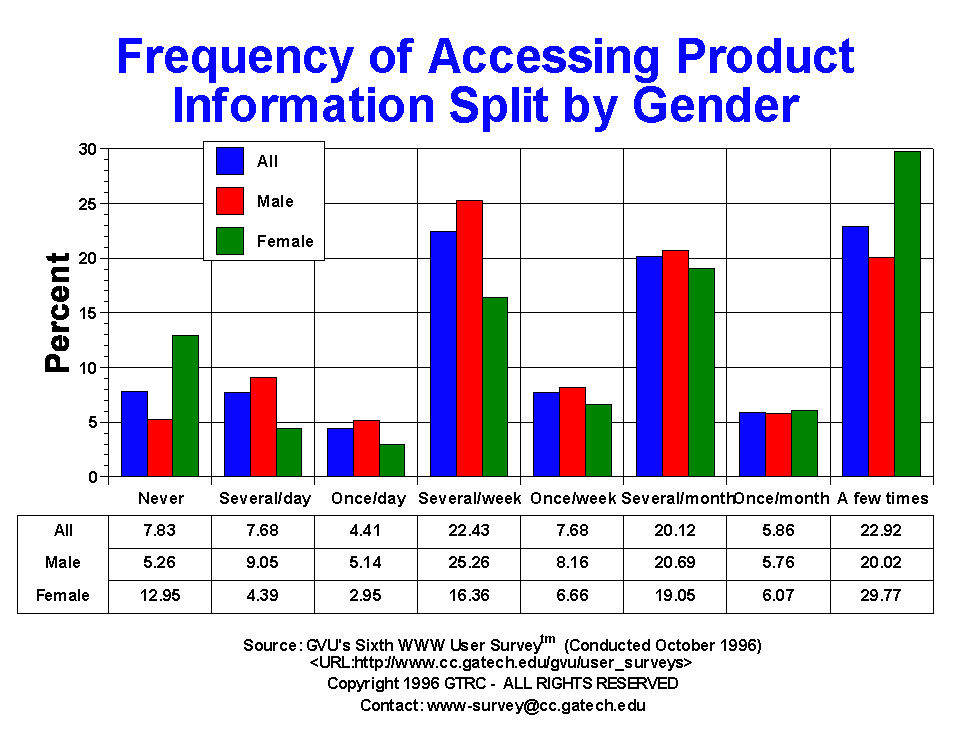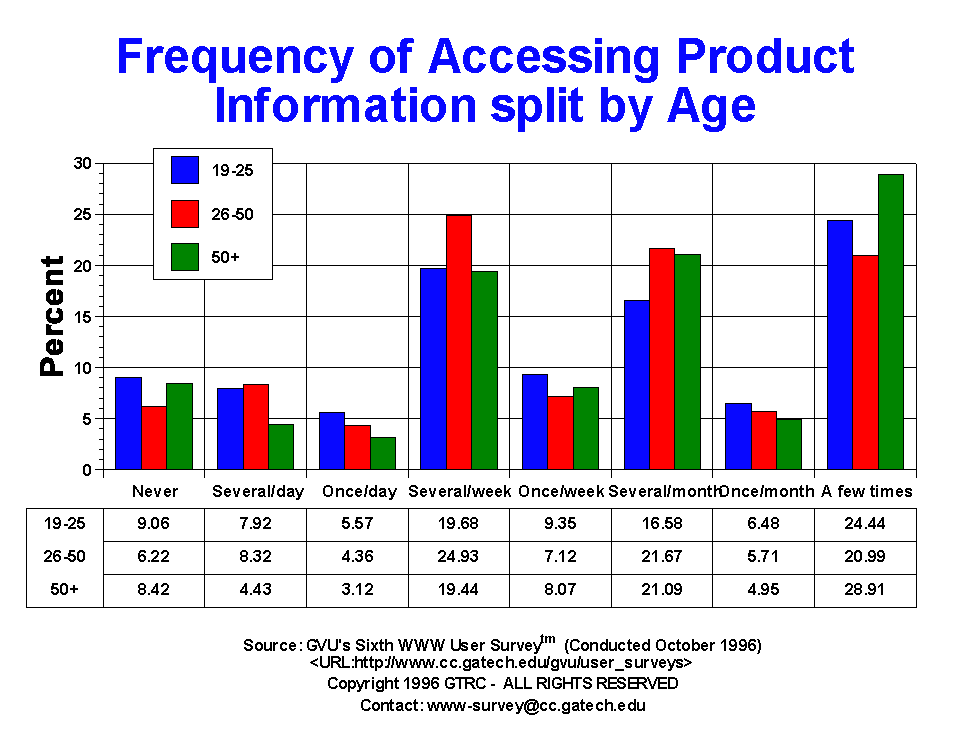

| Product Information | All | Male | Female | USA | Europe | 19-25 | 26-50 | 50+ |
| A few times | 2368.00 22.92% |
1343.00 20.02% |
908.00 29.77% |
1844.00 22.80% |
126.00 21.25% |
426.00 24.44% |
1256.00 20.99% |
333.00 28.91% |
| Don't know | 109.00 1.06% |
43.00 0.64% |
55.00 1.80% |
77.00 0.95% |
5.00 0.84% |
15.00 0.86% |
41.00 0.69% |
18.00 1.56% |
| Never | 809.00 7.83% |
353.00 5.26% |
395.00 12.95% |
584.00 7.22% |
61.00 10.29% |
158.00 9.06% |
372.00 6.22% |
97.00 8.42% |
| Once | 1.00 0.01% |
0.00 0.00% |
0.00 0.00% |
0.00 0.00% |
0.00 0.00% |
0.00 0.00% |
0.00 0.00% |
0.00 0.00% |
| Once per day | 456.00 4.41% |
345.00 5.14% |
90.00 2.95% |
363.00 4.49% |
31.00 5.23% |
97.00 5.57% |
261.00 4.36% |
36.00 3.12% |
| Once per month | 605.00 5.86% |
386.00 5.76% |
185.00 6.07% |
469.00 5.80% |
33.00 5.56% |
113.00 6.48% |
342.00 5.71% |
57.00 4.95% |
| Once per week | 793.00 7.68% |
547.00 8.16% |
203.00 6.66% |
615.00 7.61% |
43.00 7.25% |
163.00 9.35% |
426.00 7.12% |
93.00 8.07% |
| Several times per | 1.00 0.01% |
1.00 0.01% |
0.00 0.00% |
1.00 0.01% |
0.00 0.00% |
1.00 0.06% |
0.00 0.00% |
0.00 0.00% |
| Several times per day | 793.00 7.68% |
607.00 9.05% |
134.00 4.39% |
611.00 7.56% |
55.00 9.27% |
138.00 7.92% |
498.00 8.32% |
51.00 4.43% |
| Several times per month | 2079.00 20.12% |
1388.00 20.69% |
581.00 19.05% |
1678.00 20.75% |
108.00 18.21% |
289.00 16.58% |
1297.00 21.67% |
243.00 21.09% |
| Several times per week | 2317.00 22.43% |
1694.00 25.26% |
499.00 16.36% |
1844.00 22.80% |
131.00 22.09% |
343.00 19.68% |
1492.00 24.93% |
224.00 19.44% |


GVU's WWW Surveying Team
Graphics, Visualization, & Usability Center
College of Computing
Georgia Institute of Technology
Atlanta, GA 30332-0280