
| Reasons For Saving and Printing Documents | All | Male | Female | USA | Europe | 19-25 | 26-50 | 50+ |
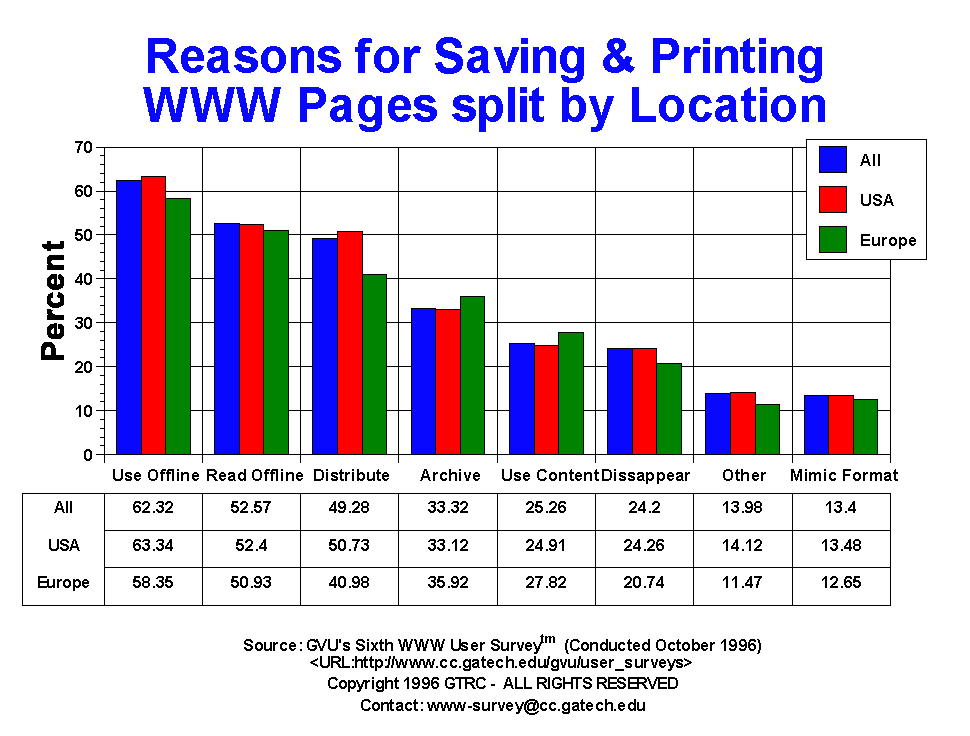
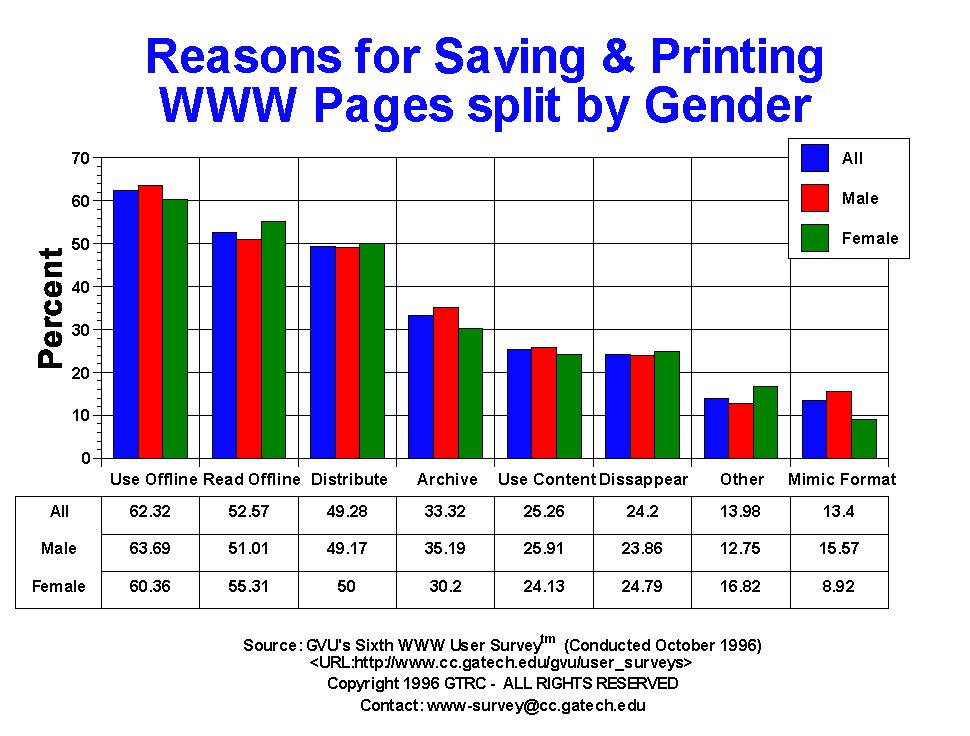
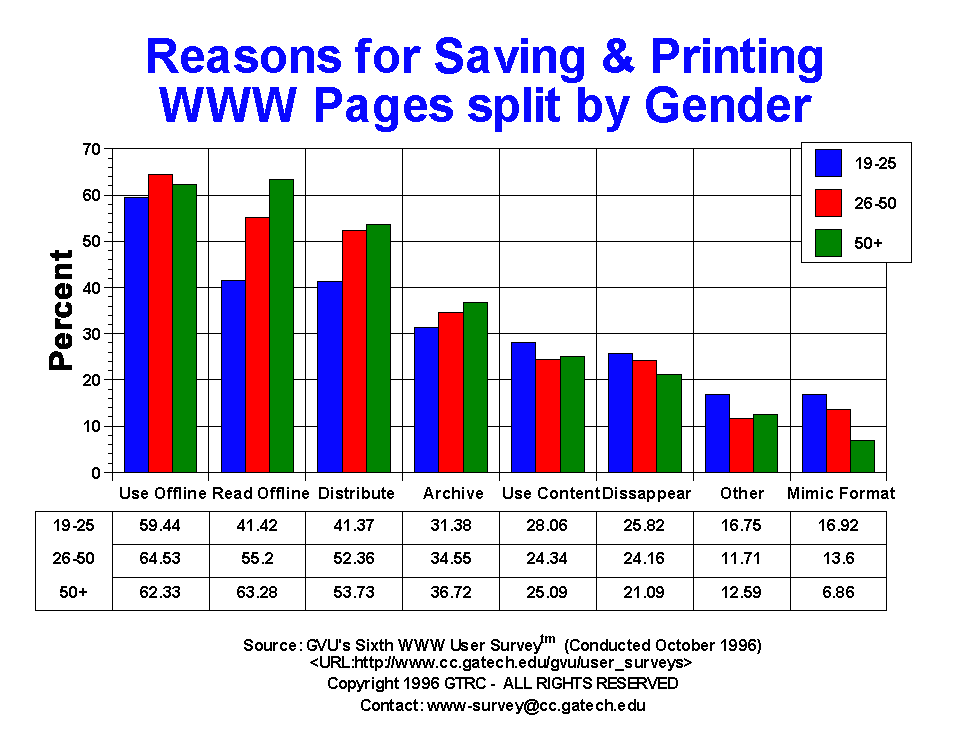
| Archive Docs | 3442.00 33.32% |
2360.00 35.19% |
921.00 30.20% |
2678.00 33.12% |
213.00 35.92% |
547.00 31.38% |
2068.00 34.55% |
423.00 36.72% |
| Distribute to Others Offline | 5091.00 49.28% |
3298.00 49.17% |
1525.00 50.00% |
4102.00 50.73% |
243.00 40.98% |
721.00 41.37% |
3134.00 52.36% |
619.00 53.73% |
| Fear Doc Will Disappear | 2500.00 24.20% |
1600.00 23.86% |
756.00 24.79% |
1962.00 24.26% |
123.00 20.74% |
450.00 25.82% |
1446.00 24.16% |
243.00 21.09% |
| Mimic Format | 1384.00 13.40% |
1044.00 15.57% |
272.00 8.92% |
1090.00 13.48% |
75.00 12.65% |
295.00 16.92% |
814.00 13.60% |
79.00 6.86% |
| Other | 1444.00 13.98% |
855.00 12.75% |
513.00 16.82% |
1142.00 14.12% |
68.00 11.47% |
292.00 16.75% |
701.00 11.71% |
145.00 12.59% |
| Read Offline | 5431.00 52.57% |
3421.00 51.01% |
1687.00 55.31% |
4237.00 52.40% |
302.00 50.93% |
722.00 41.42% |
3304.00 55.20% |
729.00 63.28% |
| Use Content | 2610.00 25.26% |
1738.00 25.91% |
736.00 24.13% |
2014.00 24.91% |
165.00 27.82% |
489.00 28.06% |
1457.00 24.34% |
289.00 25.09% |
| Use Offline | 6438.00 62.32% |
4272.00 63.69% |
1841.00 60.36% |
5122.00 63.34% |
346.00 58.35% |
1036.00 59.44% |
3862.00 64.53% |
718.00 62.33% |


GVU's WWW Surveying Team
Graphics, Visualization, & Usability Center
College of Computing
Georgia Institute of Technology
Atlanta, GA 30332-0280