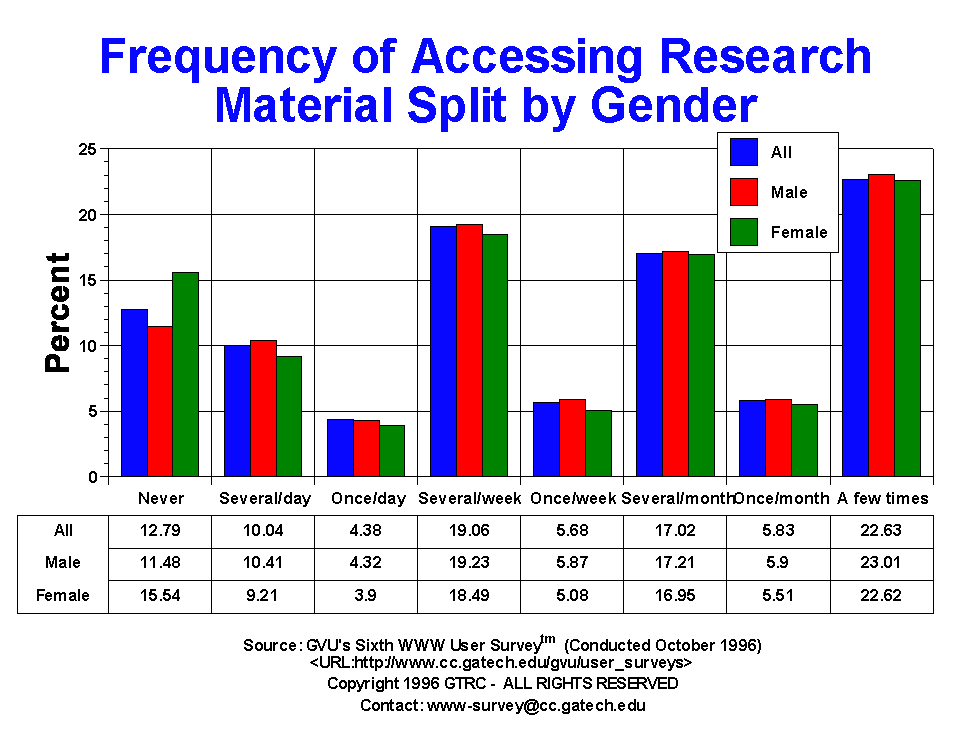

| Research Material | All | Male | Female | USA | Europe | 19-25 | 26-50 | 50+ |
| A few times | 2338.00 22.63% |
1543.00 23.01% |
690.00 22.62% |
1894.00 23.42% |
116.00 19.56% |
389.00 22.32% |
1353.00 22.61% |
304.00 26.39% |
| Don't know | 266.00 2.57% |
172.00 2.56% |
82.00 2.69% |
213.00 2.63% |
9.00 1.52% |
45.00 2.58% |
153.00 2.56% |
33.00 2.86% |
| Never | 1321.00 12.79% |
770.00 11.48% |
474.00 15.54% |
1049.00 12.97% |
69.00 11.64% |
225.00 12.91% |
757.00 12.65% |
166.00 14.41% |
| Once per day | 453.00 4.38% |
290.00 4.32% |
119.00 3.90% |
327.00 4.04% |
30.00 5.06% |
83.00 4.76% |
244.00 4.08% |
42.00 3.65% |
| Once per month | 602.00 5.83% |
396.00 5.90% |
168.00 5.51% |
460.00 5.69% |
38.00 6.41% |
116.00 6.66% |
320.00 5.35% |
58.00 5.03% |
| Once per week | 587.00 5.68% |
394.00 5.87% |
155.00 5.08% |
426.00 5.27% |
42.00 7.08% |
115.00 6.60% |
316.00 5.28% |
50.00 4.34% |
| Several times per day | 1037.00 10.04% |
698.00 10.41% |
281.00 9.21% |
802.00 9.92% |
56.00 9.44% |
155.00 8.89% |
651.00 10.88% |
106.00 9.20% |
| Several times per month | 1758.00 17.02% |
1154.00 17.21% |
517.00 16.95% |
1415.00 17.50% |
91.00 15.35% |
302.00 17.33% |
1021.00 17.06% |
176.00 15.28% |
| Several times per week | 1969.00 19.06% |
1290.00 19.23% |
564.00 18.49% |
1500.00 18.55% |
142.00 23.95% |
313.00 17.96% |
1170.00 19.55% |
217.00 18.84% |


GVU's WWW Surveying Team
Graphics, Visualization, & Usability Center
College of Computing
Georgia Institute of Technology
Atlanta, GA 30332-0280