
| American images | All | Male | Female | USA | Europe | 10-18 | 19-25 | 26-50 | 50+ | Novice | Intermediate | Expert |
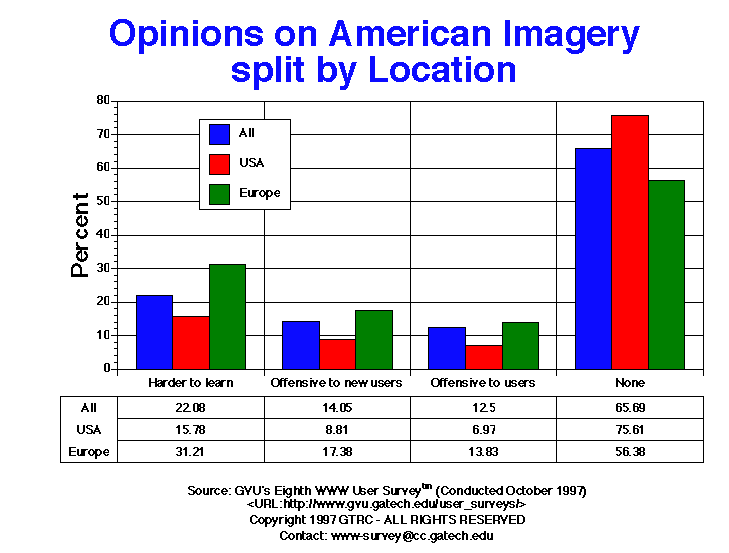
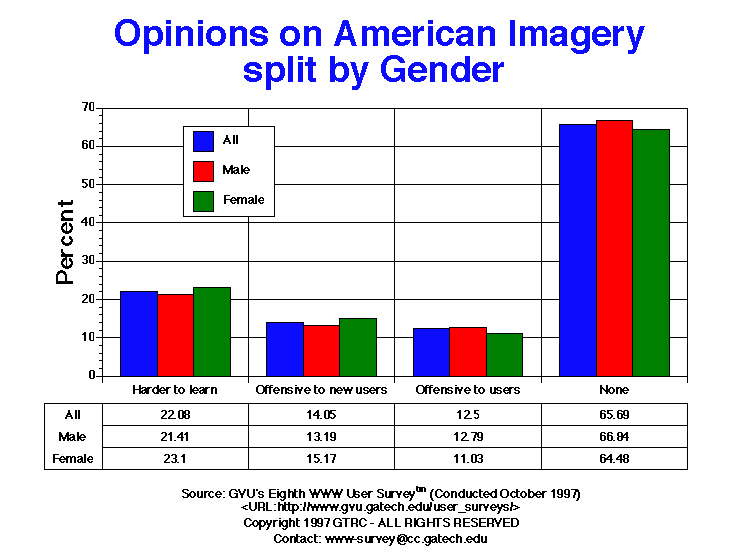
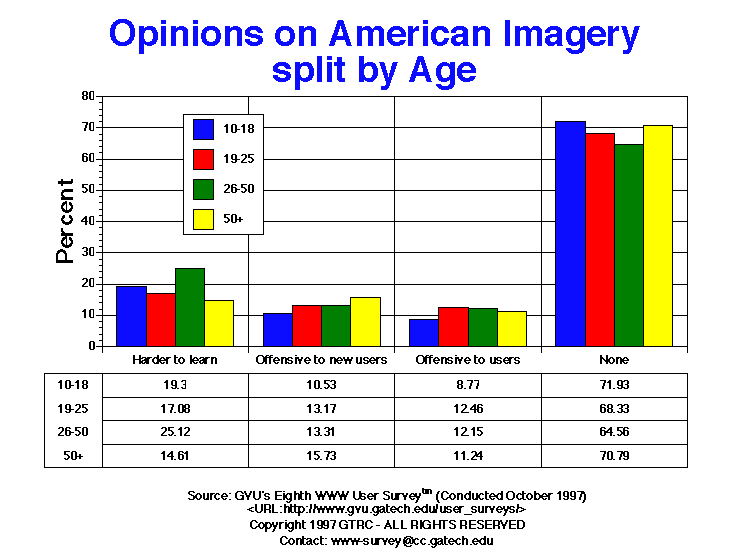
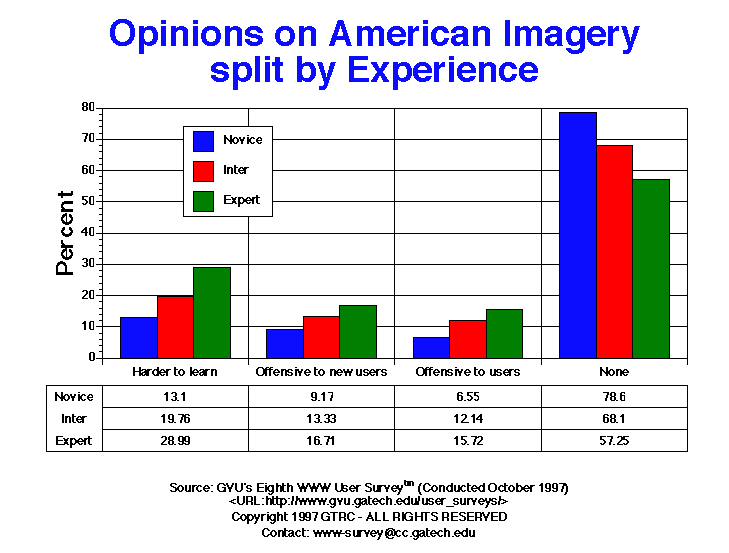
| Harder to learn | 242.00 22.08% |
164.00 21.41% |
67.00 23.10% |
77.00 15.78% |
88.00 31.21% |
11.00 19.30% |
48.00 17.08% |
151.00 25.12% |
13.00 14.61% |
30.00 13.10% |
83.00 19.76% |
118.00 28.99% |
| Offensive to new users | 154.00 14.05% |
101.00 13.19% |
44.00 15.17% |
43.00 8.81% |
49.00 17.38% |
6.00 10.53% |
37.00 13.17% |
80.00 13.31% |
14.00 15.73% |
21.00 9.17% |
56.00 13.33% |
68.00 16.71% |
| Offensive to experienced users | 137.00 12.50% |
98.00 12.79% |
32.00 11.03% |
34.00 6.97% |
39.00 13.83% |
5.00 8.77% |
35.00 12.46% |
73.00 12.15% |
10.00 11.24% |
15.00 6.55% |
51.00 12.14% |
64.00 15.72% |
| No effect | 720.00 65.69% |
512.00 66.84% |
187.00 64.48% |
369.00 75.61% |
159.00 56.38% |
41.00 71.93% |
192.00 68.33% |
388.00 64.56% |
63.00 70.79% |
180.00 78.60% |
286.00 68.10% |
233.00 57.25% |


GVU's WWW Surveying Team
Graphics, Visualization, & Usability Center
College of Computing
Georgia Institute of Technology
Atlanta, GA 30332-0280