
| Computer Experience | All | Male | Female | USA | Europe | 10-18 | 19-25 | 26-50 | 50+ | Novice | Intermediate | Expert |
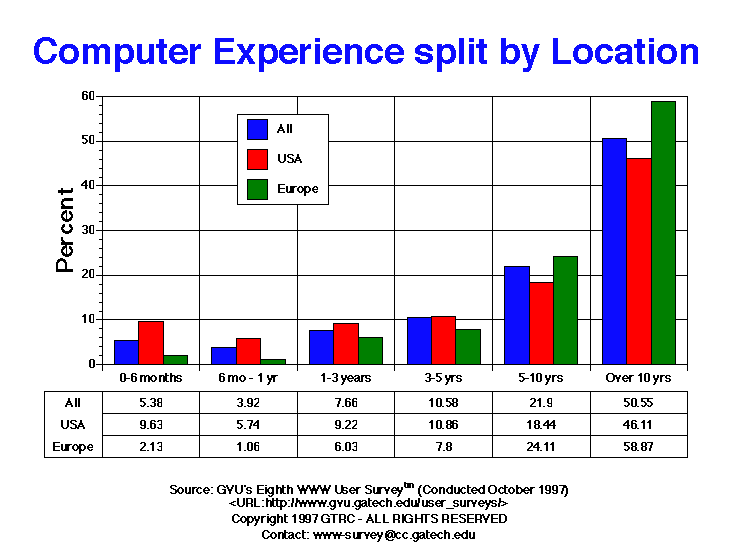
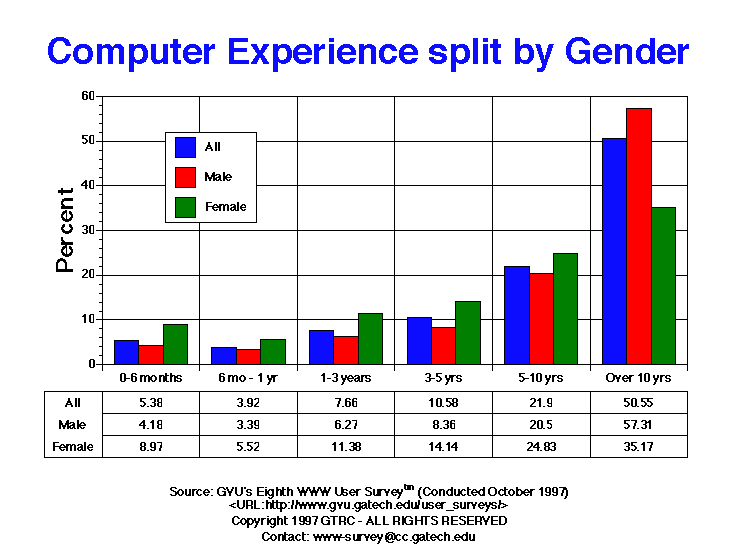
| 0-6 months | 59.00 5.38% |
32.00 4.18% |
26.00 8.97% |
47.00 9.63% |
6.00 2.13% |
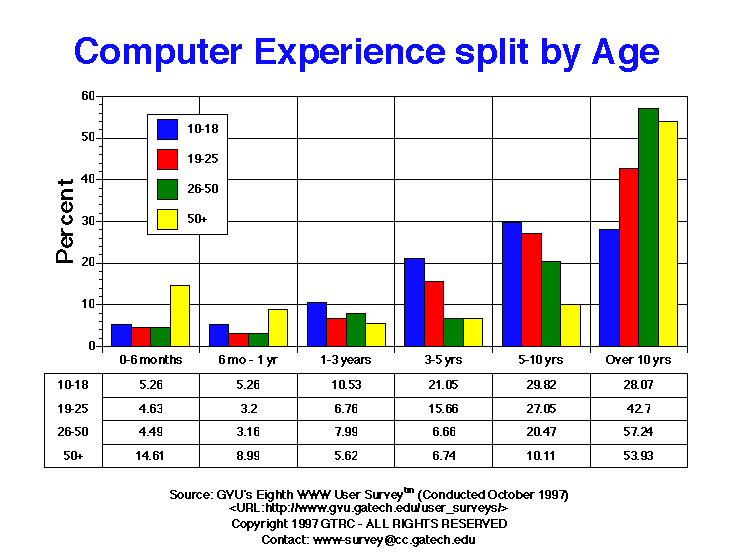
3.00 5.26% |
13.00 4.63% |
27.00 4.49% |
13.00 14.61% |
57.00 24.89% |
1.00 0.24% |
0.00 0.00% |
| 6 mo - 1 yr | 43.00 3.92% |
26.00 3.39% |
16.00 5.52% |
28.00 5.74% |
3.00 1.06% |
3.00 5.26% |
9.00 3.20% |
19.00 3.16% |
8.00 8.99% |
40.00 17.47% |
2.00 0.48% |
0.00 0.00% |
| 1-3 years | 84.00 7.66% |
48.00 6.27% |
33.00 11.38% |
45.00 9.22% |
17.00 6.03% |
6.00 10.53% |
19.00 6.76% |
48.00 7.99% |
5.00 5.62% |
15.00 6.55% |
63.00 15.00% |
3.00 0.74% |
| 3-5 years | 116.00 10.58% |
64.00 8.36% |
41.00 14.14% |
53.00 10.86% |
22.00 7.80% |
12.00 21.05% |
44.00 15.66% |
40.00 6.66% |
6.00 6.74% |
22.00 9.61% |
61.00 14.52% |
22.00 5.41% |
| 5-10 years | 240.00 21.90% |
157.00 20.50% |
72.00 24.83% |
90.00 18.44% |
68.00 24.11% |
17.00 29.82% |
76.00 27.05% |
123.00 20.47% |
9.00 10.11% |
41.00 17.90% |
100.00 23.81% |
88.00 21.62% |
| Over 10 years | 554.00 50.55% |
439.00 57.31% |
102.00 35.17% |
225.00 46.11% |
166.00 58.87% |
16.00 28.07% |
120.00 42.70% |
344.00 57.24% |
48.00 53.93% |
54.00 23.58% |
193.00 45.95% |
294.00 72.24% |


GVU's WWW Surveying Team
Graphics, Visualization, & Usability Center
College of Computing
Georgia Institute of Technology
Atlanta, GA 30332-0280