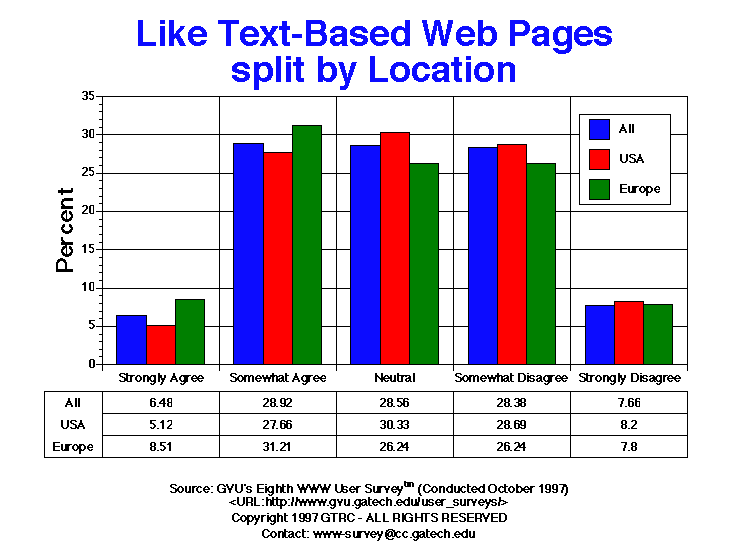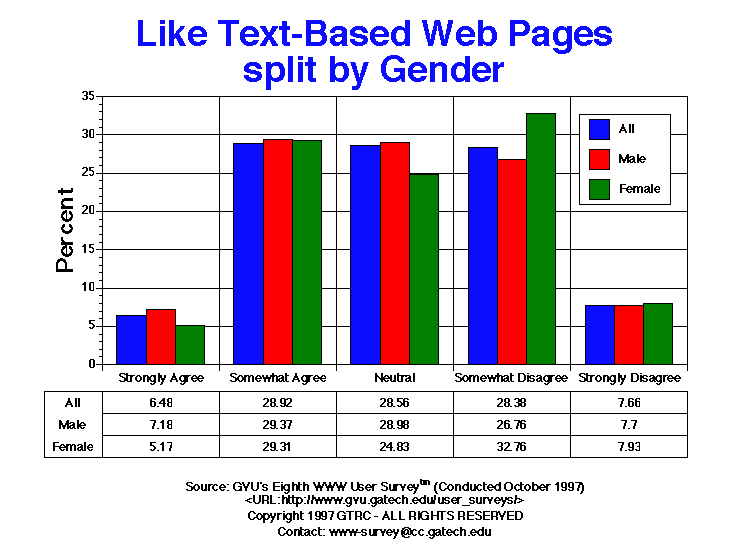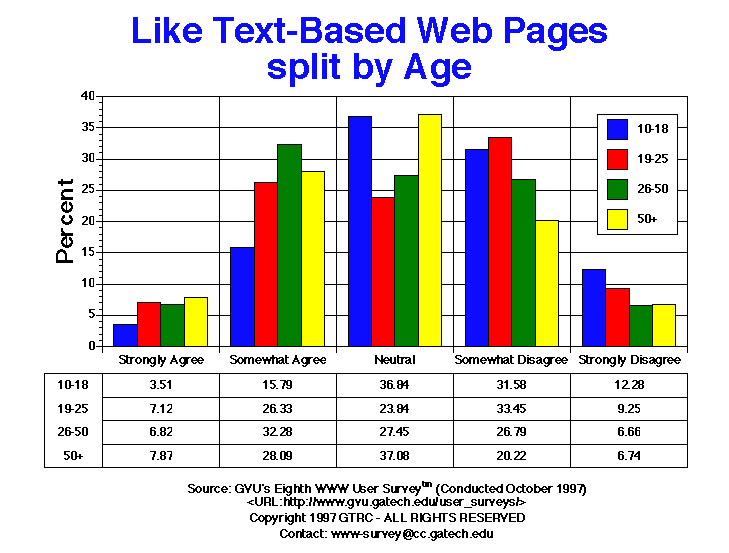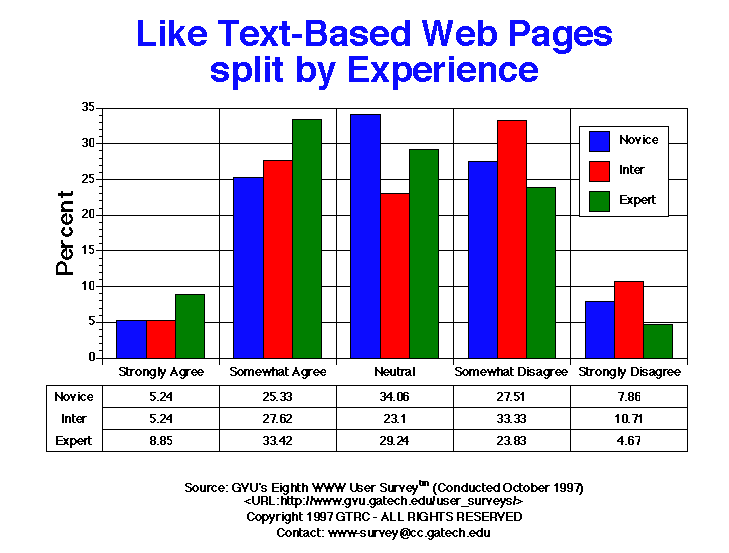

| Like text-based web pages | All | Male | Female | USA | Europe | 10-18 | 19-25 | 26-50 | 50+ | Novice | Intermediate | Expert |
| Strongly Agree | 71.00 6.48% |
55.00 7.18% |
15.00 5.17% |
25.00 5.12% |
24.00 8.51% |
2.00 3.51% |
20.00 7.12% |
41.00 6.82% |
7.00 7.87% |
12.00 5.24% |
22.00 5.24% |
36.00 8.85% |
| Somewhat Agree | 317.00 28.92% |
225.00 29.37% |
85.00 29.31% |
135.00 27.66% |
88.00 31.21% |
9.00 15.79% |
74.00 26.33% |
194.00 32.28% |
25.00 28.09% |
58.00 25.33% |
116.00 27.62% |
136.00 33.42% |
| Neither Disagree or Agree | 313.00 28.56% |
222.00 28.98% |
72.00 24.83% |
148.00 30.33% |
74.00 26.24% |
21.00 36.84% |
67.00 23.84% |
165.00 27.45% |
33.00 37.08% |
78.00 34.06% |
97.00 23.10% |
119.00 29.24% |
| Somewhat Disagree | 311.00 28.38% |
205.00 26.76% |
95.00 32.76% |
140.00 28.69% |
74.00 26.24% |
18.00 31.58% |
94.00 33.45% |
161.00 26.79% |
18.00 20.22% |
63.00 27.51% |
140.00 33.33% |
97.00 23.83% |
| Strongly Disagree | 84.00 7.66% |
59.00 7.70% |
23.00 7.93% |
40.00 8.20% |
22.00 7.80% |
7.00 12.28% |
26.00 9.25% |
40.00 6.66% |
6.00 6.74% |
18.00 7.86% |
45.00 10.71% |
19.00 4.67% |


GVU's WWW Surveying Team
Graphics, Visualization, & Usability Center
College of Computing
Georgia Institute of Technology
Atlanta, GA 30332-0280