
| Non English sites | All | Male | Female | USA | Europe | 10-18 | 19-25 | 26-50 | 50+ | Novice | Intermediate | Expert |
| All | 10.00 0.91% |
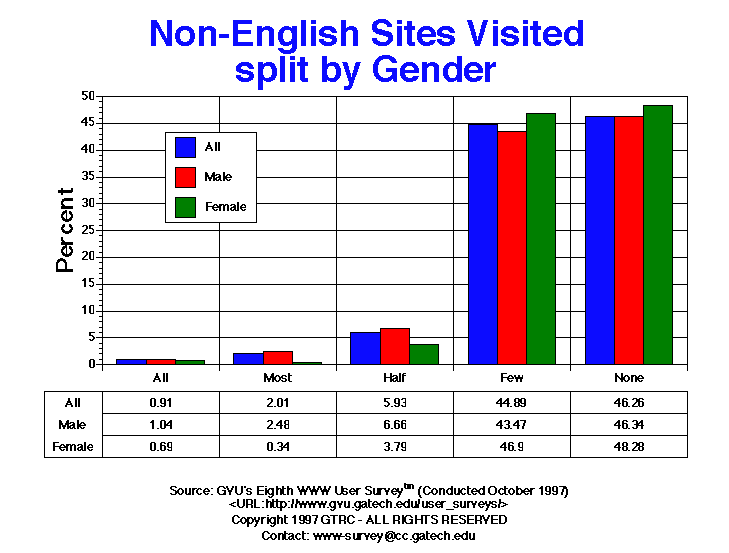
8.00 1.04% |
2.00 0.69% |
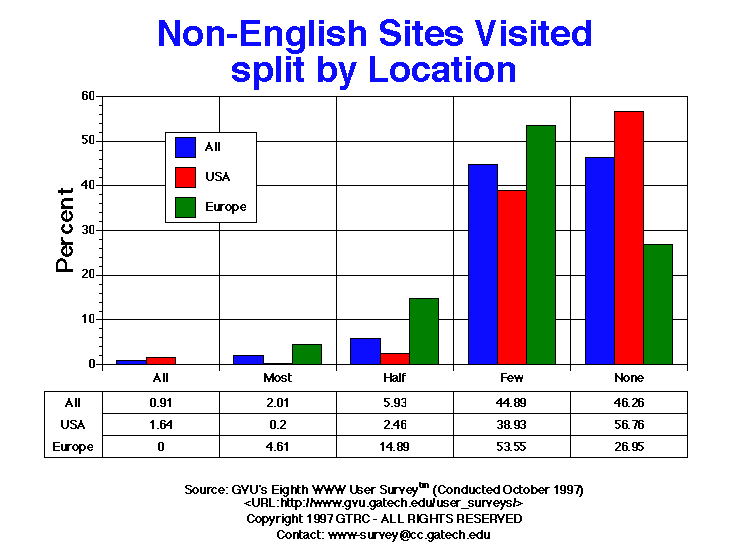
8.00 1.64% |
0.00 0.00% |
0.00 0.00% |
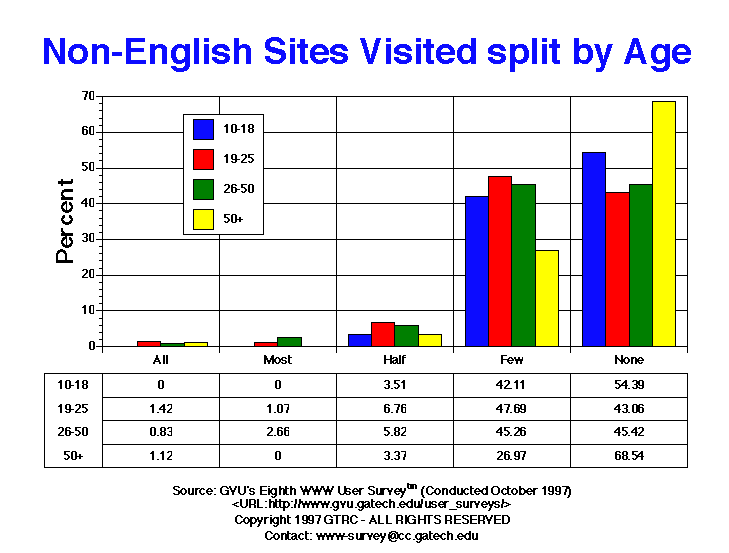
4.00 1.42% |
5.00 0.83% |
1.00 1.12% |
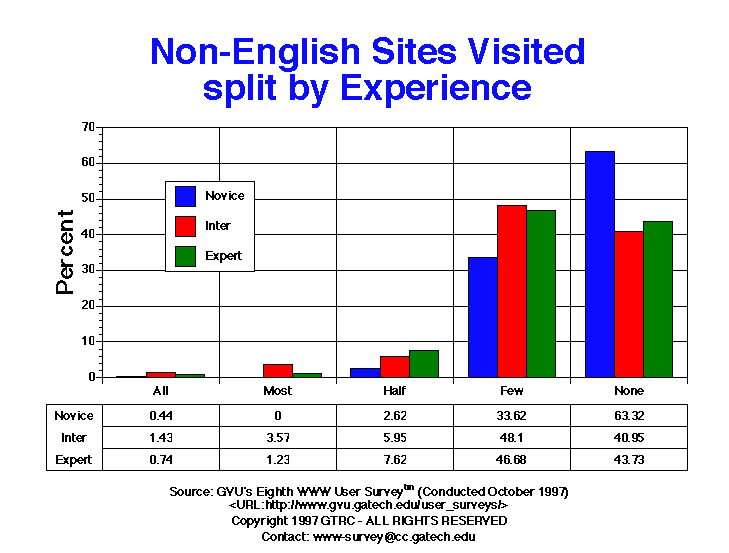
1.00 0.44% |
6.00 1.43% |
3.00 0.74% |
| Most | 22.00 2.01% |
19.00 2.48% |
1.00 0.34% |
1.00 0.20% |
13.00 4.61% |
0.00 0.00% |
3.00 1.07% |
16.00 2.66% |
0.00 0.00% |
0.00 0.00% |
15.00 3.57% |
5.00 1.23% |
| Half | 65.00 5.93% |
51.00 6.66% |
11.00 3.79% |
12.00 2.46% |
42.00 14.89% |
2.00 3.51% |
19.00 6.76% |
35.00 5.82% |
3.00 3.37% |
6.00 2.62% |
25.00 5.95% |
31.00 7.62% |
| Few | 492.00 44.89% |
333.00 43.47% |
136.00 46.90% |
190.00 38.93% |
151.00 53.55% |
24.00 42.11% |
134.00 47.69% |
272.00 45.26% |
24.00 26.97% |
77.00 33.62% |
202.00 48.10% |
190.00 46.68% |
| None | 507.00 46.26% |
355.00 46.34% |
140.00 48.28% |
277.00 56.76% |
76.00 26.95% |
31.00 54.39% |
121.00 43.06% |
273.00 45.42% |
61.00 68.54% |
145.00 63.32% |
172.00 40.95% |
178.00 43.73% |
GVU's WWW Surveying Team
Graphics, Visualization, & Usability Center
College of Computing
Georgia Institute of Technology
Atlanta, GA 30332-0280