
| Primary same as Native | All | Male | Female | USA | Europe | 10-18 | 19-25 | 26-50 | 50+ | Novice | Intermediate | Expert |
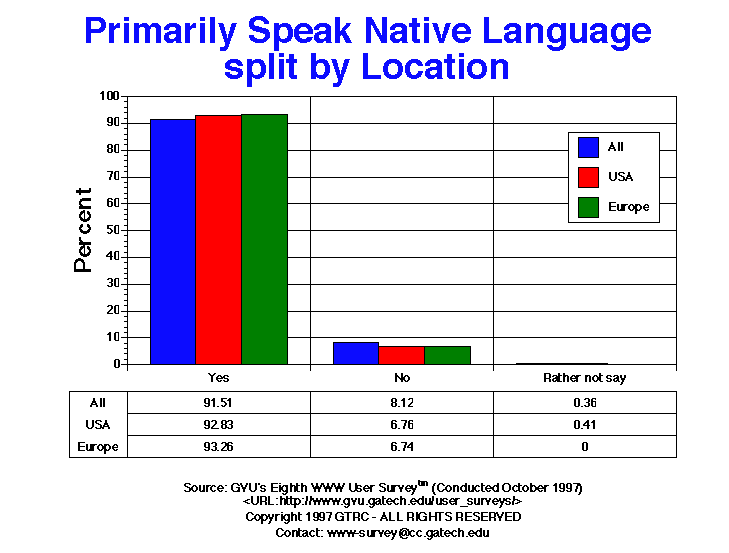
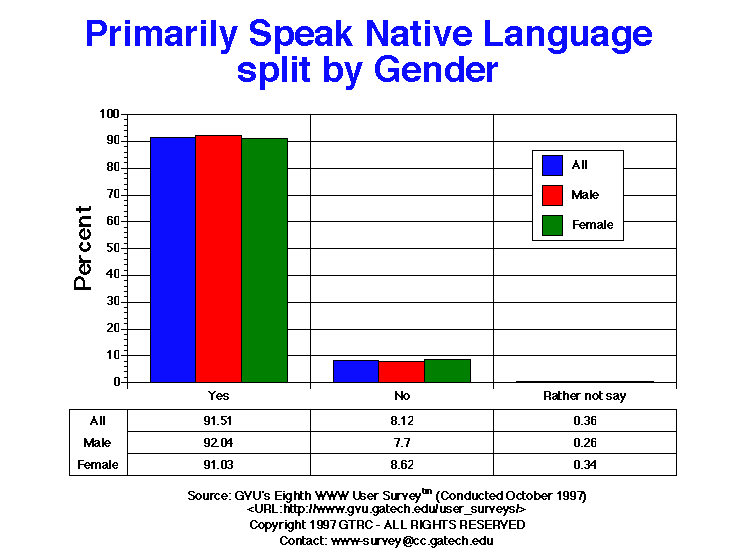
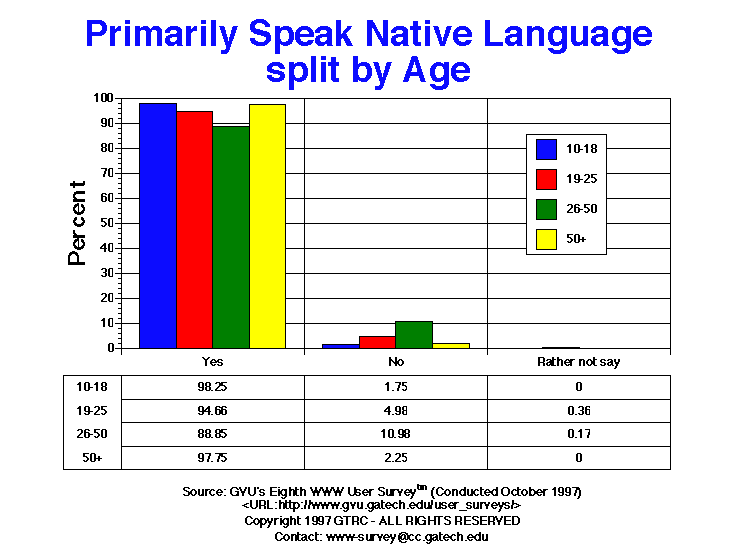
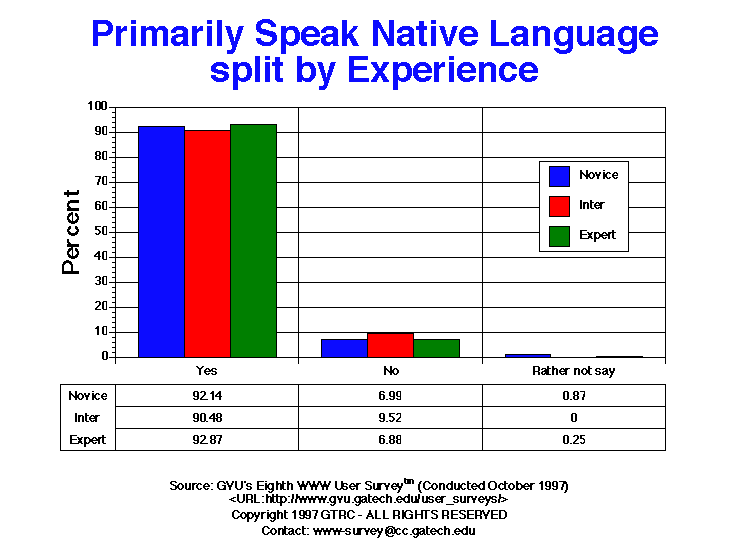
| Yes | 1003.00 91.51% |
705.00 92.04% |
264.00 91.03% |
453.00 92.83% |
263.00 93.26% |
56.00 98.25% |
266.00 94.66% |
534.00 88.85% |
87.00 97.75% |
211.00 92.14% |
380.00 90.48% |
378.00 92.87% |
| No | 89.00 8.12% |
59.00 7.70% |
25.00 8.62% |
33.00 6.76% |
19.00 6.74% |
1.00 1.75% |
14.00 4.98% |
66.00 10.98% |
2.00 2.25% |
16.00 6.99% |
40.00 9.52% |
28.00 6.88% |
| Rather not say | 4.00 0.36% |
2.00 0.26% |
1.00 0.34% |
2.00 0.41% |
0.00 0.00% |
0.00 0.00% |
1.00 0.36% |
1.00 0.17% |
0.00 0.00% |
2.00 0.87% |
0.00 0.00% |
1.00 0.25% |


GVU's WWW Surveying Team
Graphics, Visualization, & Usability Center
College of Computing
Georgia Institute of Technology
Atlanta, GA 30332-0280