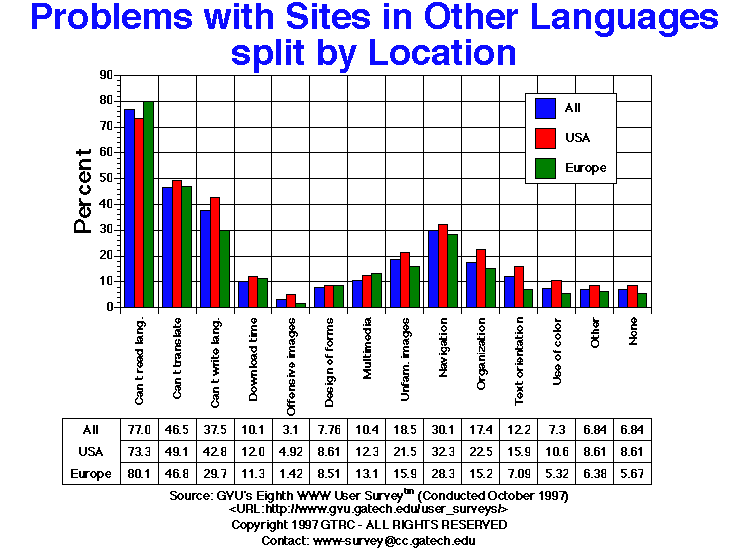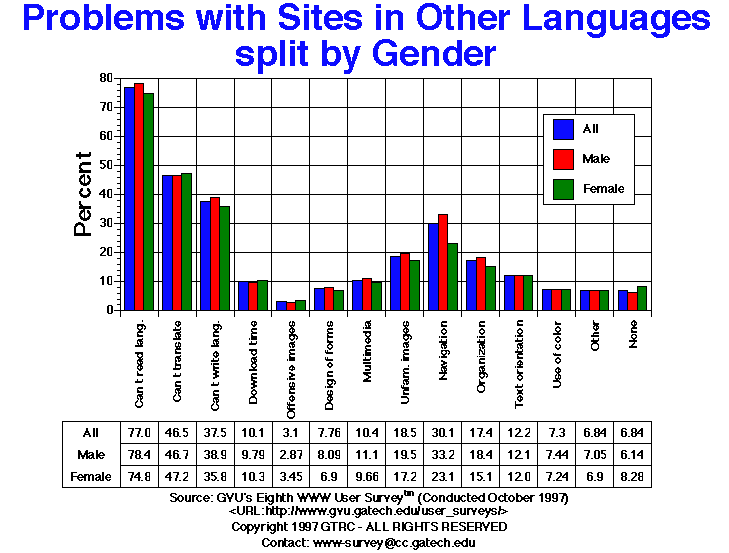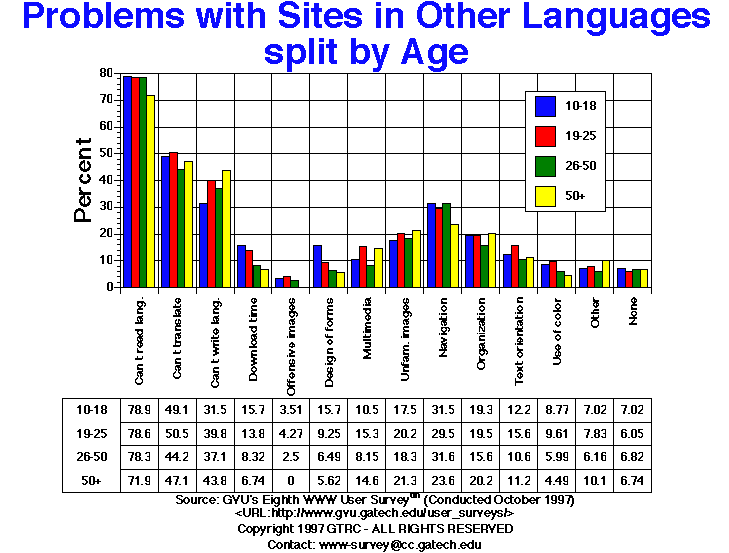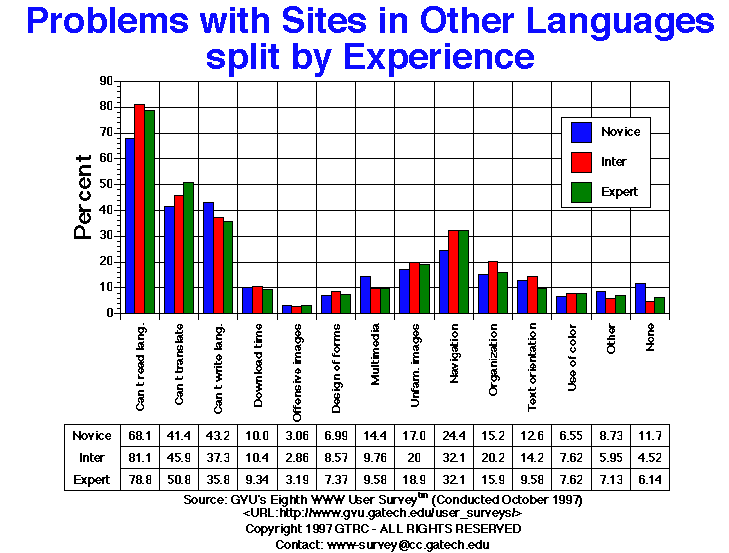

| Problems with unfamiliar language sites | All | Male | Female | USA | Europe | 10-18 | 19-25 | 26-50 | 50+ | Novice | Intermediate | Expert |
| Can't read language | 844.00 77.01% |
601.00 78.46% |
217.00 74.83% |
358.00 73.36% |
226.00 80.14% |
45.00 78.95% |
221.00 78.65% |
471.00 78.37% |
64.00 71.91% |
156.00 68.12% |
341.00 81.19% |
321.00 78.87% |
| Can't translate | 510.00 46.53% |
358.00 46.74% |
137.00 47.24% |
240.00 49.18% |
132.00 46.81% |
28.00 49.12% |
142.00 50.53% |
266.00 44.26% |
42.00 47.19% |
95.00 41.48% |
193.00 45.95% |
207.00 50.86% |
| Can't write language | 412.00 37.59% |
298.00 38.90% |
104.00 35.86% |
209.00 42.83% |
84.00 29.79% |
18.00 31.58% |
112.00 39.86% |
223.00 37.10% |
39.00 43.82% |
99.00 43.23% |
157.00 37.38% |
146.00 35.87% |
| Download time | 111.00 10.13% |
75.00 9.79% |
30.00 10.34% |
59.00 12.09% |
32.00 11.35% |
9.00 15.79% |
39.00 13.88% |
50.00 8.32% |
6.00 6.74% |
23.00 10.04% |
44.00 10.48% |
38.00 9.34% |
| Offensive images | 34.00 3.10% |
22.00 2.87% |
10.00 3.45% |
24.00 4.92% |
4.00 1.42% |
2.00 3.51% |
12.00 4.27% |
15.00 2.50% |
0.00 0.00% |
7.00 3.06% |
12.00 2.86% |
13.00 3.19% |
| Poorly designed forms | 85.00 7.76% |
62.00 8.09% |
20.00 6.90% |
42.00 8.61% |
24.00 8.51% |
9.00 15.79% |
26.00 9.25% |
39.00 6.49% |
5.00 5.62% |
16.00 6.99% |
36.00 8.57% |
30.00 7.37% |
| Unclear multimedia | 114.00 10.40% |
85.00 11.10% |
28.00 9.66% |
60.00 12.30% |
37.00 13.12% |
6.00 10.53% |
43.00 15.30% |
49.00 8.15% |
13.00 14.61% |
33.00 14.41% |
41.00 9.76% |
39.00 9.58% |
| Unfamiliar images | 203.00 18.52% |
150.00 19.58% |
50.00 17.24% |
105.00 21.52% |
45.00 15.96% |
10.00 17.54% |
57.00 20.28% |
110.00 18.30% |
19.00 21.35% |
39.00 17.03% |
84.00 20.00% |
77.00 18.92% |
| Unfamiliar navigation | 330.00 30.11% |
255.00 33.29% |
67.00 23.10% |
158.00 32.38% |
80.00 28.37% |
18.00 31.58% |
83.00 29.54% |
190.00 31.61% |
21.00 23.60% |
56.00 24.45% |
135.00 32.14% |
131.00 32.19% |
| Unfamiliar organization | 191.00 17.43% |
141.00 18.41% |
44.00 15.17% |
110.00 22.54% |
43.00 15.25% |
11.00 19.30% |
55.00 19.57% |
94.00 15.64% |
18.00 20.22% |
35.00 15.28% |
85.00 20.24% |
65.00 15.97% |
| Unfamiliar text orientation | 134.00 12.23% |
93.00 12.14% |
35.00 12.07% |
78.00 15.98% |
20.00 7.09% |
7.00 12.28% |
44.00 15.66% |
64.00 10.65% |
10.00 11.24% |
29.00 12.66% |
60.00 14.29% |
39.00 9.58% |
| Use of color | 80.00 7.30% |
57.00 7.44% |
21.00 7.24% |
52.00 10.66% |
15.00 5.32% |
5.00 8.77% |
27.00 9.61% |
36.00 5.99% |
4.00 4.49% |
15.00 6.55% |
32.00 7.62% |
31.00 7.62% |
| Other | 75.00 6.84% |
54.00 7.05% |
20.00 6.90% |
42.00 8.61% |
18.00 6.38% |
4.00 7.02% |
22.00 7.83% |
37.00 6.16% |
9.00 10.11% |
20.00 8.73% |
25.00 5.95% |
29.00 7.13% |
| None | 75.00 6.84% |
47.00 6.14% |
24.00 8.28% |
42.00 8.61% |
16.00 5.67% |
4.00 7.02% |
17.00 6.05% |
41.00 6.82% |
6.00 6.74% |
27.00 11.79% |
19.00 4.52% |
25.00 6.14% |


GVU's WWW Surveying Team
Graphics, Visualization, & Usability Center
College of Computing
Georgia Institute of Technology
Atlanta, GA 30332-0280