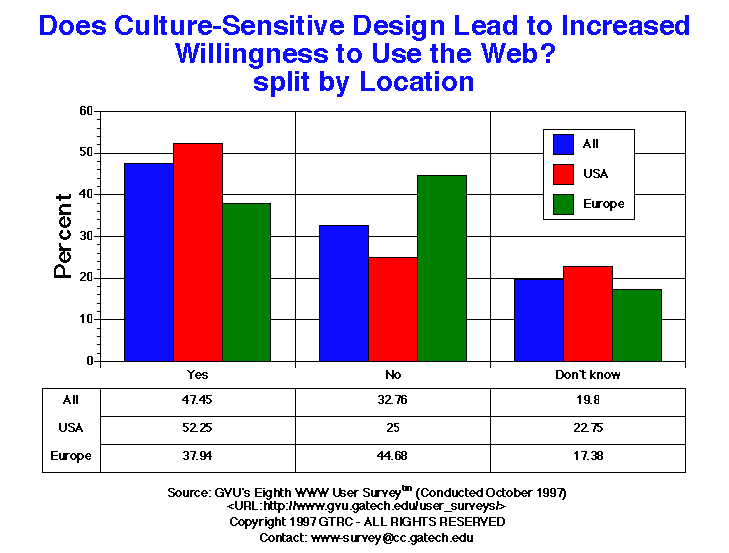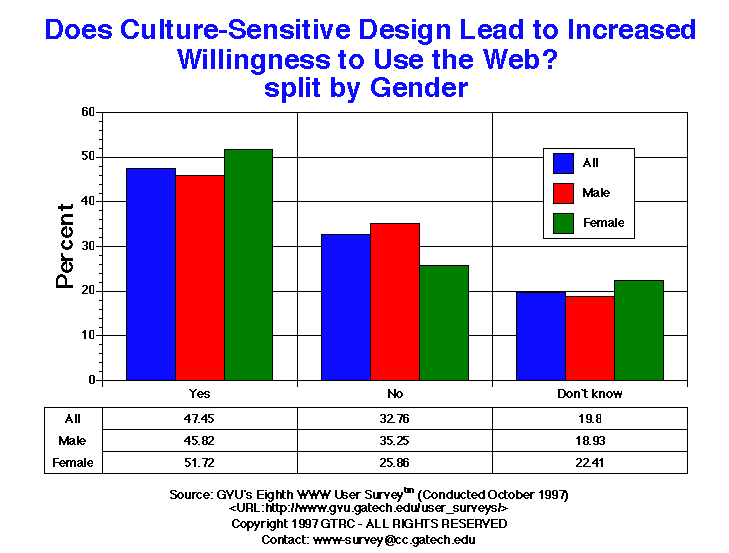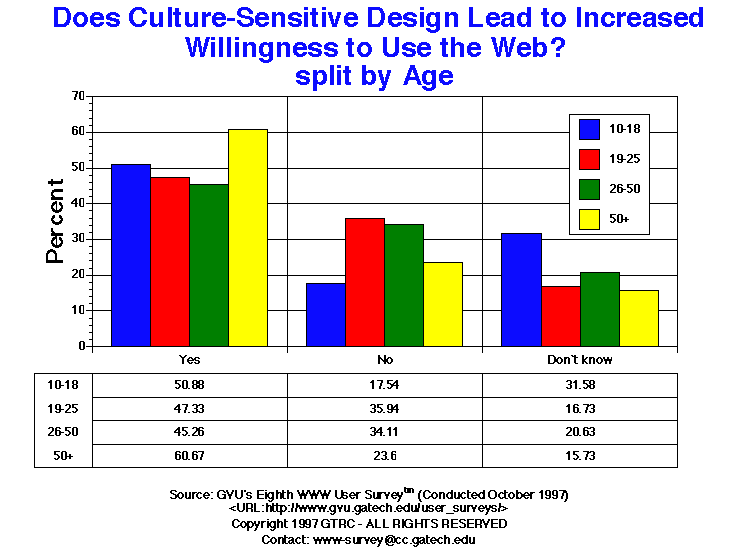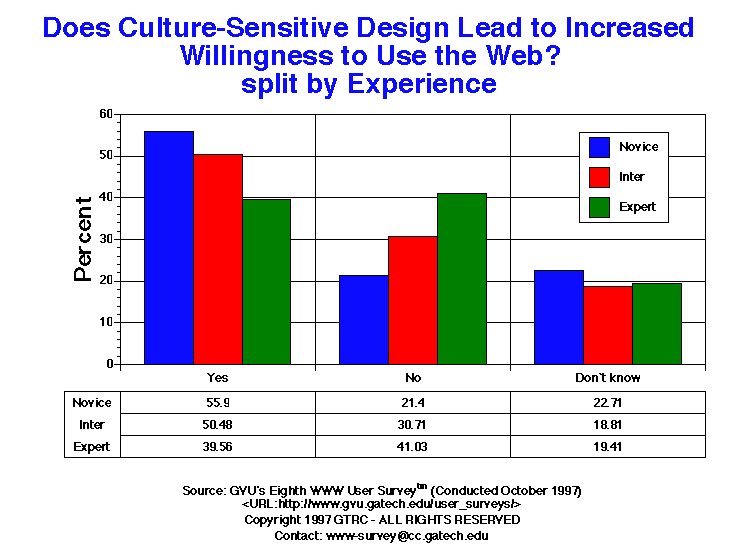

| Sites designed for culture | All | Male | Female | USA | Europe | 10-18 | 19-25 | 26-50 | 50+ | Novice | Intermediate | Expert |
| Don`t know | 217.00 19.80% |
145.00 18.93% |
65.00 22.41% |
111.00 22.75% |
49.00 17.38% |
18.00 31.58% |
47.00 16.73% |
124.00 20.63% |
14.00 15.73% |
52.00 22.71% |
79.00 18.81% |
79.00 19.41% |
| No | 359.00 32.76% |
270.00 35.25% |
75.00 25.86% |
122.00 25.00% |
126.00 44.68% |
10.00 17.54% |
101.00 35.94% |
205.00 34.11% |
21.00 23.60% |
49.00 21.40% |
129.00 30.71% |
167.00 41.03% |
| Yes | 520.00 47.45% |
351.00 45.82% |
150.00 51.72% |
255.00 52.25% |
107.00 37.94% |
29.00 50.88% |
133.00 47.33% |
272.00 45.26% |
54.00 60.67% |
128.00 55.90% |
212.00 50.48% |
161.00 39.56% |


GVU's WWW Surveying Team
Graphics, Visualization, & Usability Center
College of Computing
Georgia Institute of Technology
Atlanta, GA 30332-0280