
| Software | All | Male | Female | USA | Europe | 10-18 | 19-25 | 26-50 | 50+ | Novice | Intermediate | Expert |
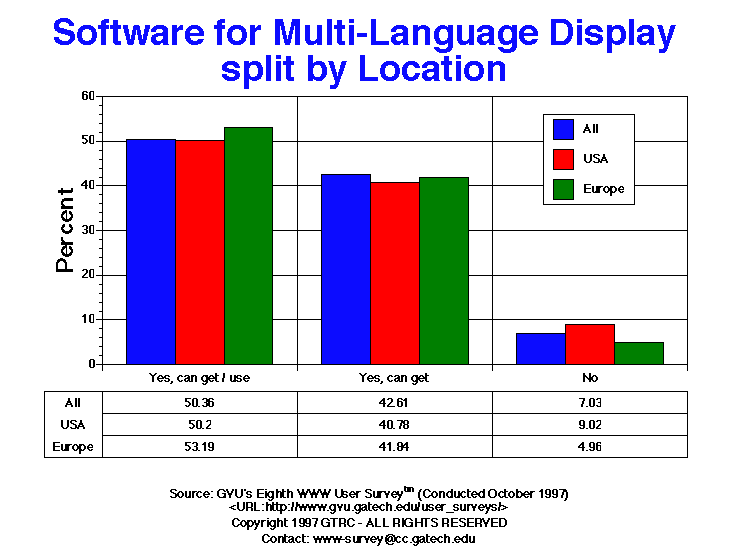
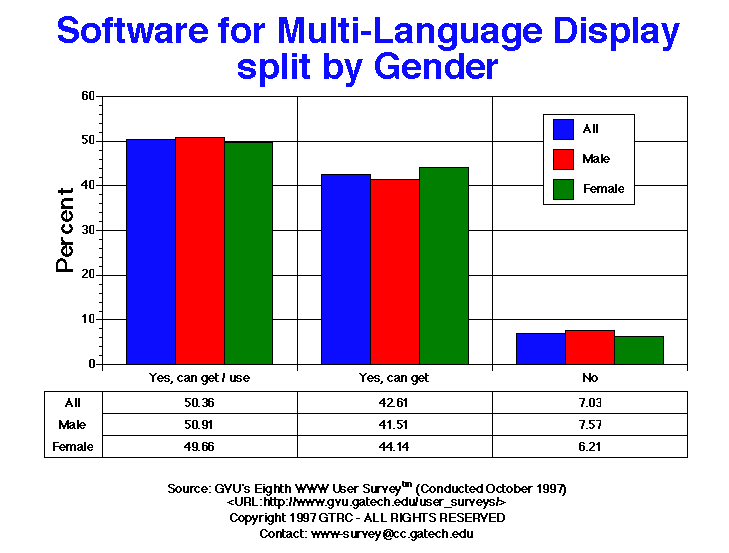
| Yes, get | 467.00 42.61% |
318.00 41.51% |
128.00 44.14% |
199.00 40.78% |
118.00 41.84% |
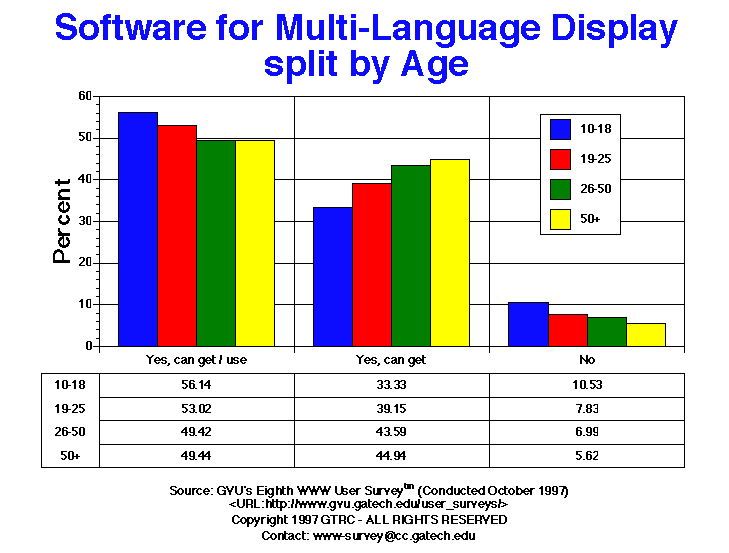
19.00 33.33% |
110.00 39.15% |
262.00 43.59% |
40.00 44.94% |
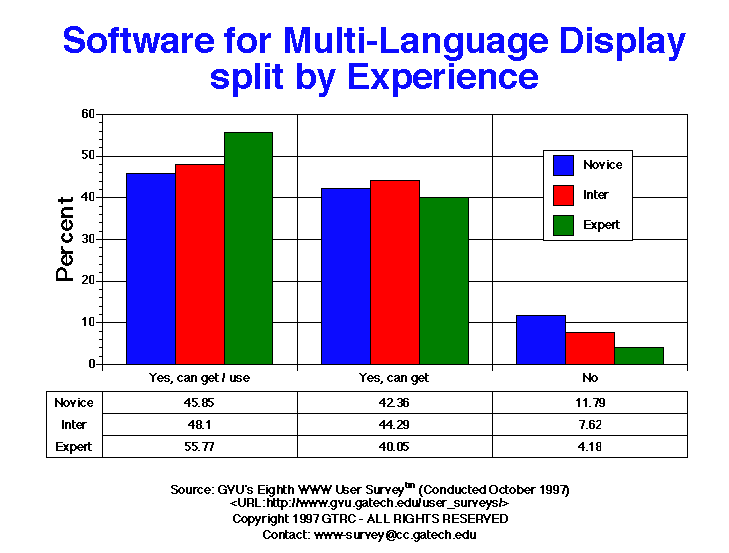
97.00 42.36% |
186.00 44.29% |
163.00 40.05% |
| Yes, get and use |
552.00 50.36% |
390.00 50.91% |
144.00 49.66% |
245.00 50.20% |
150.00 53.19% |
32.00 56.14% |
149.00 53.02% |
297.00 49.42% |
44.00 49.44% |
105.00 45.85% |
202.00 48.10% |
227.00 55.77% |
| No | 77.00 7.03% |
58.00 7.57% |
18.00 6.21% |
44.00 9.02% |
14.00 4.96% |
6.00 10.53% |
22.00 7.83% |
42.00 6.99% |
5.00 5.62% |
27.00 11.79% |
32.00 7.62% |
17.00 4.18% |


GVU's WWW Surveying Team
Graphics, Visualization, & Usability Center
College of Computing
Georgia Institute of Technology
Atlanta, GA 30332-0280